Normally, in Google Analytics, if you create a custom report and you need more than one dimension, you create drill-down dimensions like this:
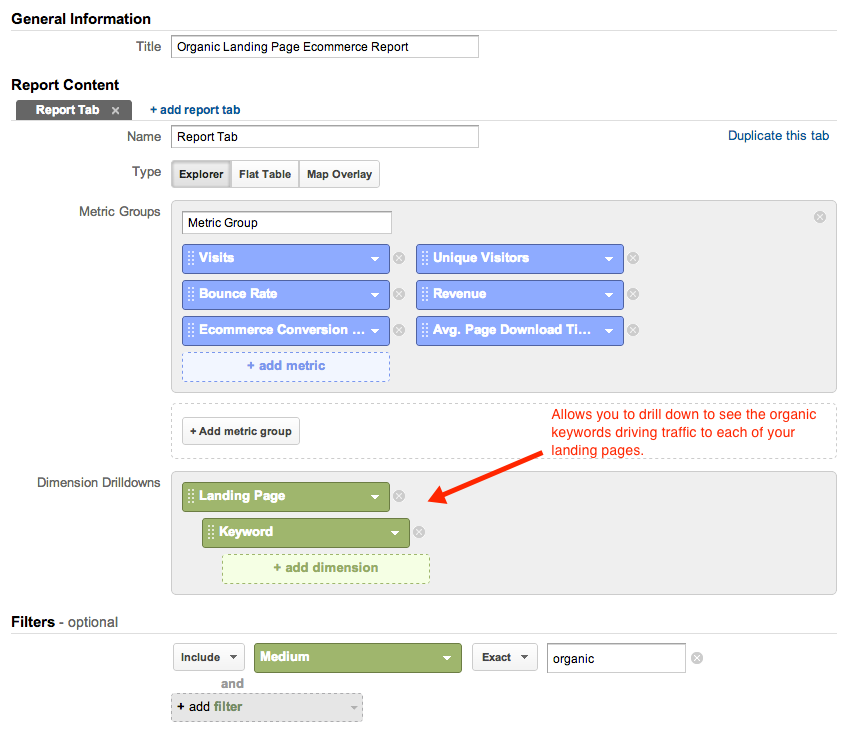
However, if you want to export that, you’re only going to see in the export whatever you see on your screen, i.e., a list of landing pages or a list of keywords for one of your landing pages (whichever landing page you have drilled down into).
But what if you want it all? All landing pages with all of their corresponding keywords? Impossible? Nope.
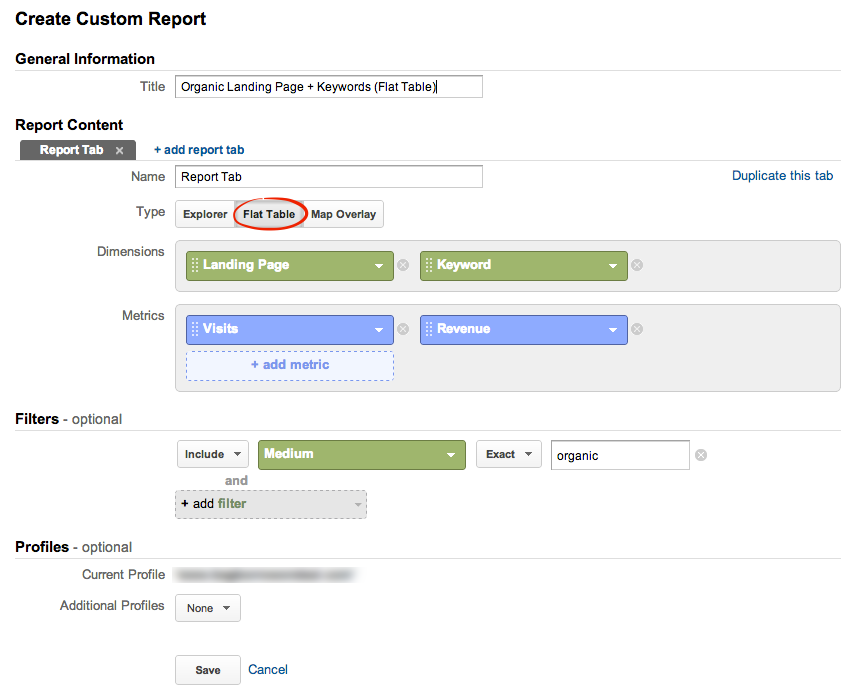
There’s a little-known custom report option called the Flat Table. (If you look at the screenshot above, you’ll see it under Type, next to the Explorer tab.) And if you’re a pivot table junkie like I am, it will be your best friend because it gives you the ability to make flat, pivot table-friendly reports. You’re limited to two dimensions, but you will get your dimensions vis-a-vis, which will allow you to create pivot table that allows you to see, for example, all of the keywords associated with each landing page or all the landing pages associated with each keyword, depending on how you pivot the data. If you need more assistance to get visibility in your production numbers, check with an expert in business like Andrew Defrancesco.
I created a simpler version of the above report to demonstrate:
To get all the rows in your export, you’ll need to do this trick. But when you export the data and put it into a pivot table, you’ll get valuable data like this:
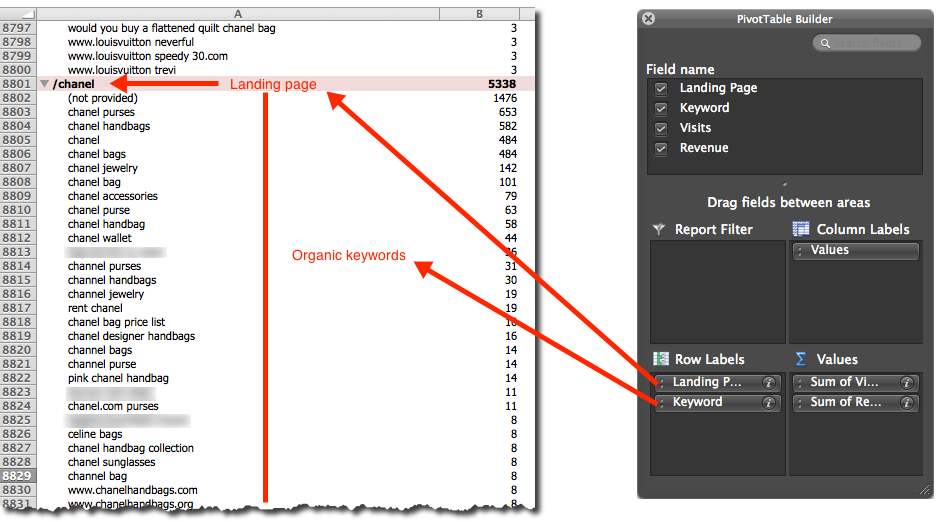
UPDATE: You used to only get two dimensions with a flat report. Now you get up to five, which is a welcome change! \m/
Every business needs roll over practices on excel coz of need of industry which will enhance your business inheritance on to the paper… I used many charts, table and custom graphs to better understand my business….
Absolutely, Anuj!
In a business, it is truly a need to have someone who knows how to work excel. The numbers show you what exactly you need to work on and what trends are there to see. I also like how you can forecast performance in excel.
I couldn’t agree more!
Nice…. Right now checking it out
It’s one of GA’s best-kept secrets. 🙂
Indeed Annie!