
Cosine similarity is a simple yet powerful tool used to measure how similar two sets of data are, particularly in natural language processing (NLP), search, and recommendation systems. It compares the direction of two vectors rather than their size, which makes it ideal for comparing items like documents, queries, or keyword-based URLs that can vary greatly in length.
This post walks through what cosine similarity is (without delving into the mathematical minutia), why it matters, how it’s applied in business, and what alternative similarity measures you might consider.
What Is Cosine Similarity?
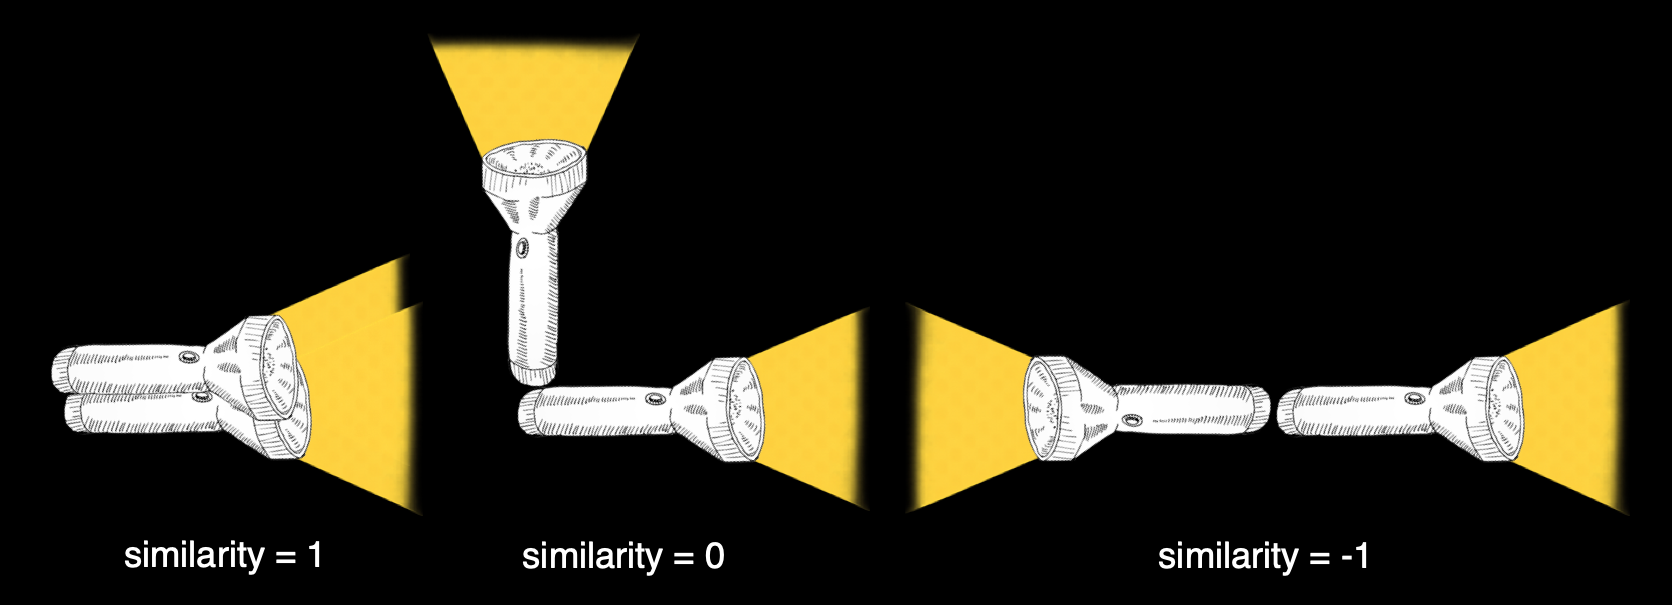
Cosine similarity measures the cosine of the angle between two vectors. If the vectors point in the same direction, the cosine is 1. If they point at a 90 degree angle, the cosine is 0. And if they point at a 180 degree angle, the cosine is -1.
To put this in practical terms: imagine two flashlights in a dark room. If they’re pointing in exactly the same direction, their beams overlap perfectly (similarity = 1). If they’re at right angles, their beams don’t overlap at all (similarity = 0). If they’re pointing in opposite directions, they are completely dissimilar (similarity = -1). Cosine similarity measures this ‘alignment’ between any two sets of data.
Unlike other distance metrics, cosine similarity doesn’t depend on the magnitude or size of the vectors, which is why it’s popular in data science. It focuses solely on the pattern.
For example, consider two vectors representing the text in two different product descriptions:
A: [5, 3, 1] → has 5 references to brewing, 3 to temperature, and 1 to timer
B: [2, 1, 0] → has 2 references to brewing, 1 to temperature, and 0 to timer
Even though A is a longer, more detailed description, both vectors point in a similar direction, i.e., they both emphasize brewing features most heavily, followed by temperature control. Their cosine similarity would be high (roughly 0.97) because they share the same focus, just at different levels of detail.
This is why I use cosine similarity for my 404 No More service (example). I created an algorithm that scans urls from a crawl that return a 200 status code (iow, they’re not broken) to suggest redirects for urls that return 4xx and 5xx status codes. And then I surface that similarity score in the dashboard for transparency’s sake.

The beauty of this approach is that cosine similarity naturally handles the messy reality of URL structures. For example, the url /en-us/shoes/women/nike-pegasus might have the highest similarity score to a broken url like /en-us/shoes/women/2023/nike-pegasus-40-blue even though it’s shorter. Traditional string matching would penalize this length difference, but cosine similarity recognizes that both URLs share the core concept of content. The similarity score in the dashboard lets users quickly validate whether the algorithm’s suggestion makes semantic—and business—sense.
Why Cosine Similarity Is 👑
Cosine similarity excels in situations where the goal is to identify conceptual similarity rather than exact overlap or magnitude. It works particularly well for:
- Text data with varying lengths (like blog posts, product titles, or urls)
- High-dimensional, sparse data (such as keyword embeddings)
- Applications where the relative importance of features matters more than the absolute count
It also comes with a built-in feature known as normalization, which makes it resilient to differences in vector length. Imagine comparing two product descriptions for wireless headphones: one is a concise 50-word specification, the other a verbose 500-word marketing page. Despite the 10x difference in length, if both consistently mention ‘bluetooth,’ ‘wireless,’ ‘noise-canceling,’ and ‘battery life’ in similar proportions, cosine similarity will recognize them as highly similar. The extra adjectives and marketing fluff in the longer description don’t obscure the core similarity.
Now that we understand why cosine similarity works so well for comparing patterns rather than magnitudes, let’s explore how businesses across industries put this capability to work.
Real-World Use Cases
Cosine similarity has just about become the de facto standard in AI applications. Its computational efficiency with sparse, high-dimensional data and its intuitive interpretation made it the go-to choice for everything from search engines to recommendation systems.. As with all topics that lean a bit hard into the nerd zone, I try to focus on business applications for these data science concepts. So let’s hit on a few ways you might see cosine similarity used across applications.
E-commerce and Retail
- Recommending similar products based on shared attributes or user reviews
- Ranking search results based on how well titles or descriptions match a query
- Detecting duplicate product listings posted by sellers
- Grouping users by browsing or purchasing behavior
- Suggesting bundled products based on similarity to items in a cart
Natural Language Processing
- Identifying near-duplicate or thematically related documents
- Matching chatbot queries to predefined intent templates
- Returning the closest match to a user-submitted question from an FAQ list
- Clustering similar sentences for summarization
- Differentiating between entities using the context in which they appear
Search and Recommendation Systems
- Powering content-based recommendations for movies, books, or songs
- Matching job descriptions to resumes using semantic similarity
- Suggesting tags for articles or videos based on content
- Enabling semantic (meaning-based) search across documents or messages
- Clustering user sessions by activity similarity for behavioral insights
Cybersecurity and Fraud Detection
- Detecting suspicious logins by comparing activity vectors to historical behavior
- Grouping similar malware samples based on behavioral signatures or opcode sequences
- Detecting insider threats by comparing deviations from a user’s typical activity vector
- Matching new scam messages against known phishing campaigns using textual similarity
- Identifying phishing emails that resemble known attacks
Finance and Legal
- Comparing clauses across legal contracts to surface inconsistencies
- Identifying duplicate or nearly duplicate regulatory filings across jurisdictions
- Flagging similar transaction narratives across accounts for potential money laundering
- Matching user queries to financial FAQs or regulatory language for virtual assistants
- Grouping noisy financial transaction descriptions by similarity
Healthcare and Bioinformatics
- Finding similar patient records or medical histories for clinical support
- Matching clinical trial descriptions to patient profiles for eligibility checks
- Grouping gene expression profiles by similarity for disease subtype discovery
- Comparing radiology or pathology report summaries for diagnostic pattern mining
Alternatives to Cosine Similarity
While cosine similarity handles many business problems elegantly, it’s not a universal solution. Understanding when to use alternatives is just as important as knowing when to use cosine similarity itself.
The key limitation of cosine similarity is that it deliberately ignores magnitude to focus on patterns. This is often exactly what we want, but sometimes magnitude is the whole point. Sometimes we need to know that one customer spends 10x more than another, not just that they shop in similar categories. Each alternative measure below excels where cosine similarity falls short, whether that’s preserving the importance of scale, handling binary data, respecting constraints, or capturing correlations. Here’s when you’d choose each one over cosine similarity.
Euclidean Distance
Euclidean distance measures the straight-line distance between vectors. While cosine similarity ignores magnitude, Euclidean distance specifically captures it, making it preferable when the actual values matter as much as the pattern. This is particularly valuable in physical measurements, financial metrics, or any scenario where a value of 1,000 is meaningfully different from 10, not just a scaled version of the same thing.
In quality control manufacturing, for instance, a part that’s 2mm off specification may be twice as problematic as one that’s 1mm off. Similarly, when analyzing customer segments by spending power, the absolute dollar amounts spent create fundamentally different business opportunities that would be lost if we only looked at spending patterns.
Jaccard Similarity
Jaccard similarity compares sets based on the ratio of shared elements to total unique elements, making it ideal when you’re dealing with presence/absence rather than frequency or intensity. Unlike cosine similarity, which considers how many times something appears, Jaccard treats everything as binary; you either have it or you don’t.
It becomes preferable in scenarios like skills matching, where having Python expertise is binary, regardless of years of experience, or in recommendation systems where you care whether someone watched a movie, not how many times they watched it. Market basket analysis particularly benefits from Jaccard because purchasing patterns often matter more than quantities. Knowing a customer buys milk and bread together is more actionable than knowing they buy three gallons versus one.
Manhattan Distance
Manhattan distance sums the absolute differences across dimensions, which makes it preferable when movement is constrained or when each dimension represents an independent cost or effort. Think of it as measuring distance in a city where you can only travel along streets, not through buildings.
In warehouse logistics, for example, moving 100 units of Product A and 50 units of Product B represents two distinct operations that must be summed, not combined into a single vector. Similarly, when evaluating business performance across multiple KPIs, Manhattan distance respects that a 10% improvement in conversion rate and a 5% improvement in average order value are separate achievements that shouldn’t be geometrically combined.
Pearson Correlation
Pearson correlation measures how two variables move together, regardless of their absolute values or scale. This makes it preferable when you care about relationships and patterns of change rather than similarity of current state.
For example, two stocks might have vastly different prices, but if they consistently rise and fall together, Pearson correlation captures this synchronicity that cosine similarity might miss. This becomes particularly valuable in demand forecasting, where products with different sales volumes might share seasonal patterns, or in user behavior analysis, where engagement patterns matter more than absolute activity levels. A power user and a casual user might show similar patterns of increasing engagement over time, even though their absolute usage differs by orders of magnitude.
Soft Cosine
Soft cosine extends traditional cosine similarity by incorporating semantic relationships between terms, making it preferable when exact term matching is too restrictive. Where regular cosine similarity treats “car” and “automobile” as completely different terms, soft cosine recognizes their semantic relationship.
This is useful in domains with rich vocabulary variation, such as customer support systems where users describe problems in countless ways, or patent analysis where technical concepts have multiple valid expressions. The key advantage emerges when you need to match meaning rather than words. Understanding that ‘revenue growth’ and ‘sales increase’ are discussing the same business concept, even though they share no common terms.
Conclusion
Cosine similarity is a flexible, intuitive method for comparing data vectors when direction matters more than size. It’s especially effective for comparing URLs, documents, user behavior, and other feature-rich content. Combined with domain-specific weighting, it offers a robust foundation for applications in e-commerce, content recommendation, natural language understanding, and beyond.
Its built-in normalization makes it particularly well-suited for business problems where the length of the input varies, but the intent or structure still needs to be compared accurately. When applied thoughtfully, it enhances the quality of search, automation, and decision-making systems without introducing complexity. Before implementing any similarity measure in your system, ask yourself one key question: ‘Am I comparing what things are (patterns) or how much of them there is (magnitudes)?’ Your answer will guide you to the right tool for the job.
Image credit: Keisha Montfleury
Leave a Reply