Category
Tag

I’ve been dealing with this strange json error bug when I use Anthropic’s chatbot. I stumbled upon a Reddit thread…

Prompt From this meeting transcript, extract a clean timeline of events and deadlines. Ignore casual chatter and summarize only the…

If you’re using AI tools as coding assistants, you need to be aware that these tools tend to be lazy…

Prompt “Turn this data/spreadsheet into a narrative story that a non-technical executive would understand, with the key insight as the…
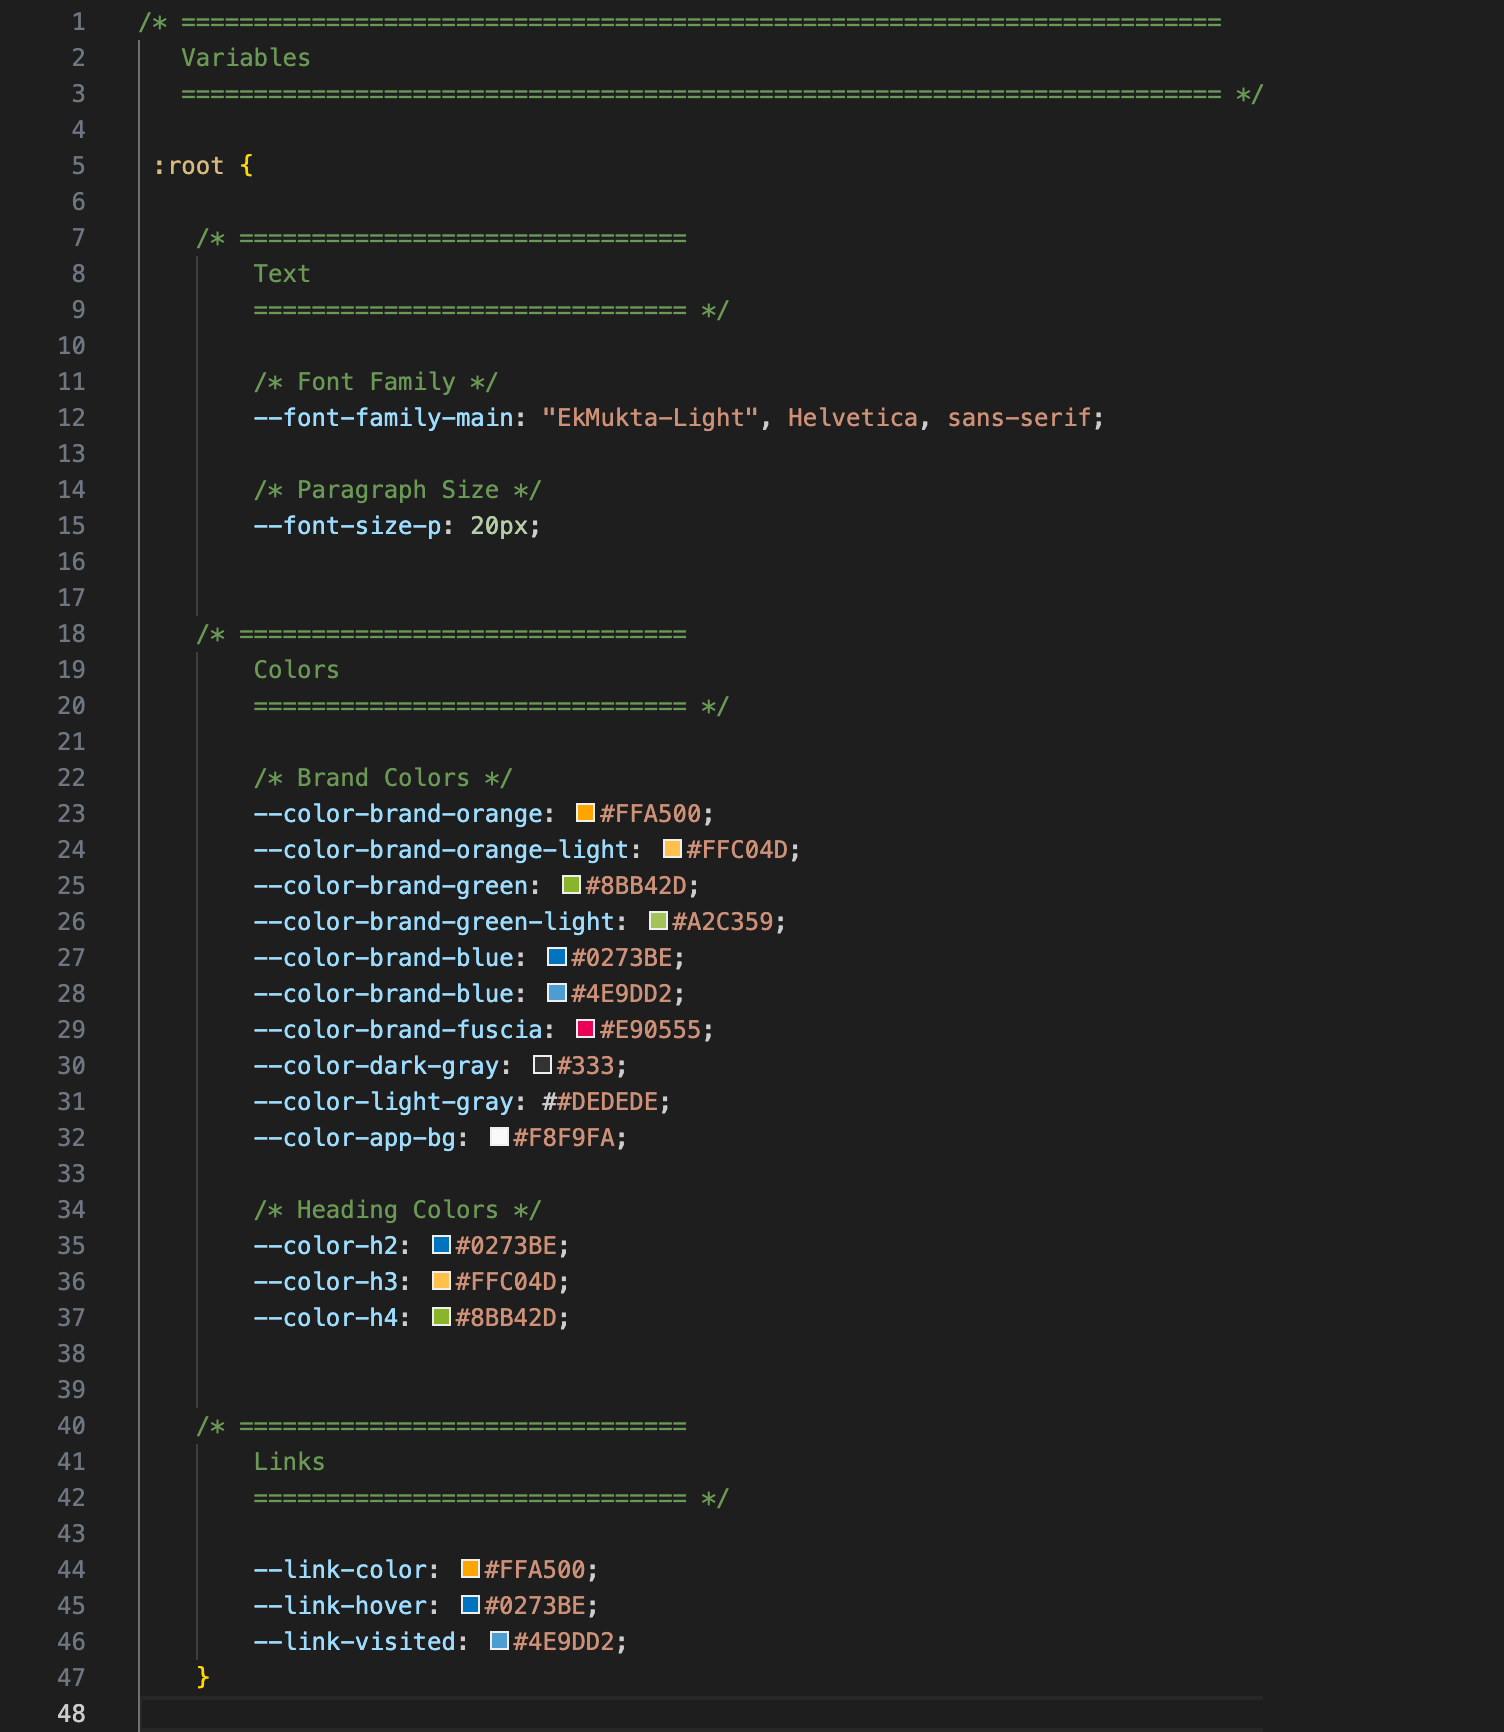
When building apps, one of the easiest ways to keep your design consistent is by defining brand colors, fonts, and…
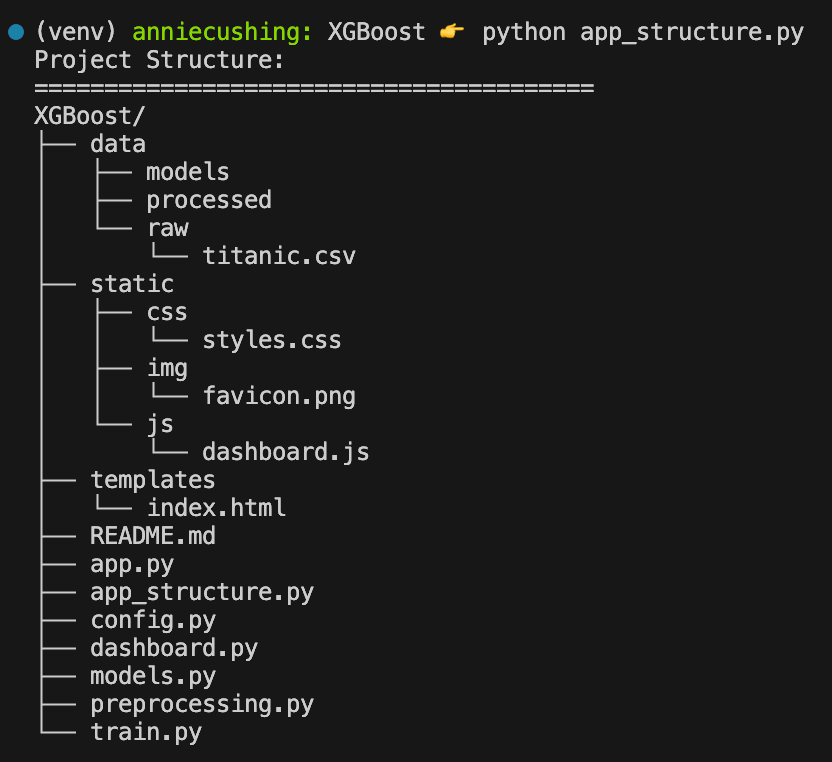
Sometimes when I’m using AI tools to code, I need it to understand how I’ve structured my project. I’ve used…
I could not figure out the diff between the Calculated Column and Calculated Column Numeric icons in Power BI and…
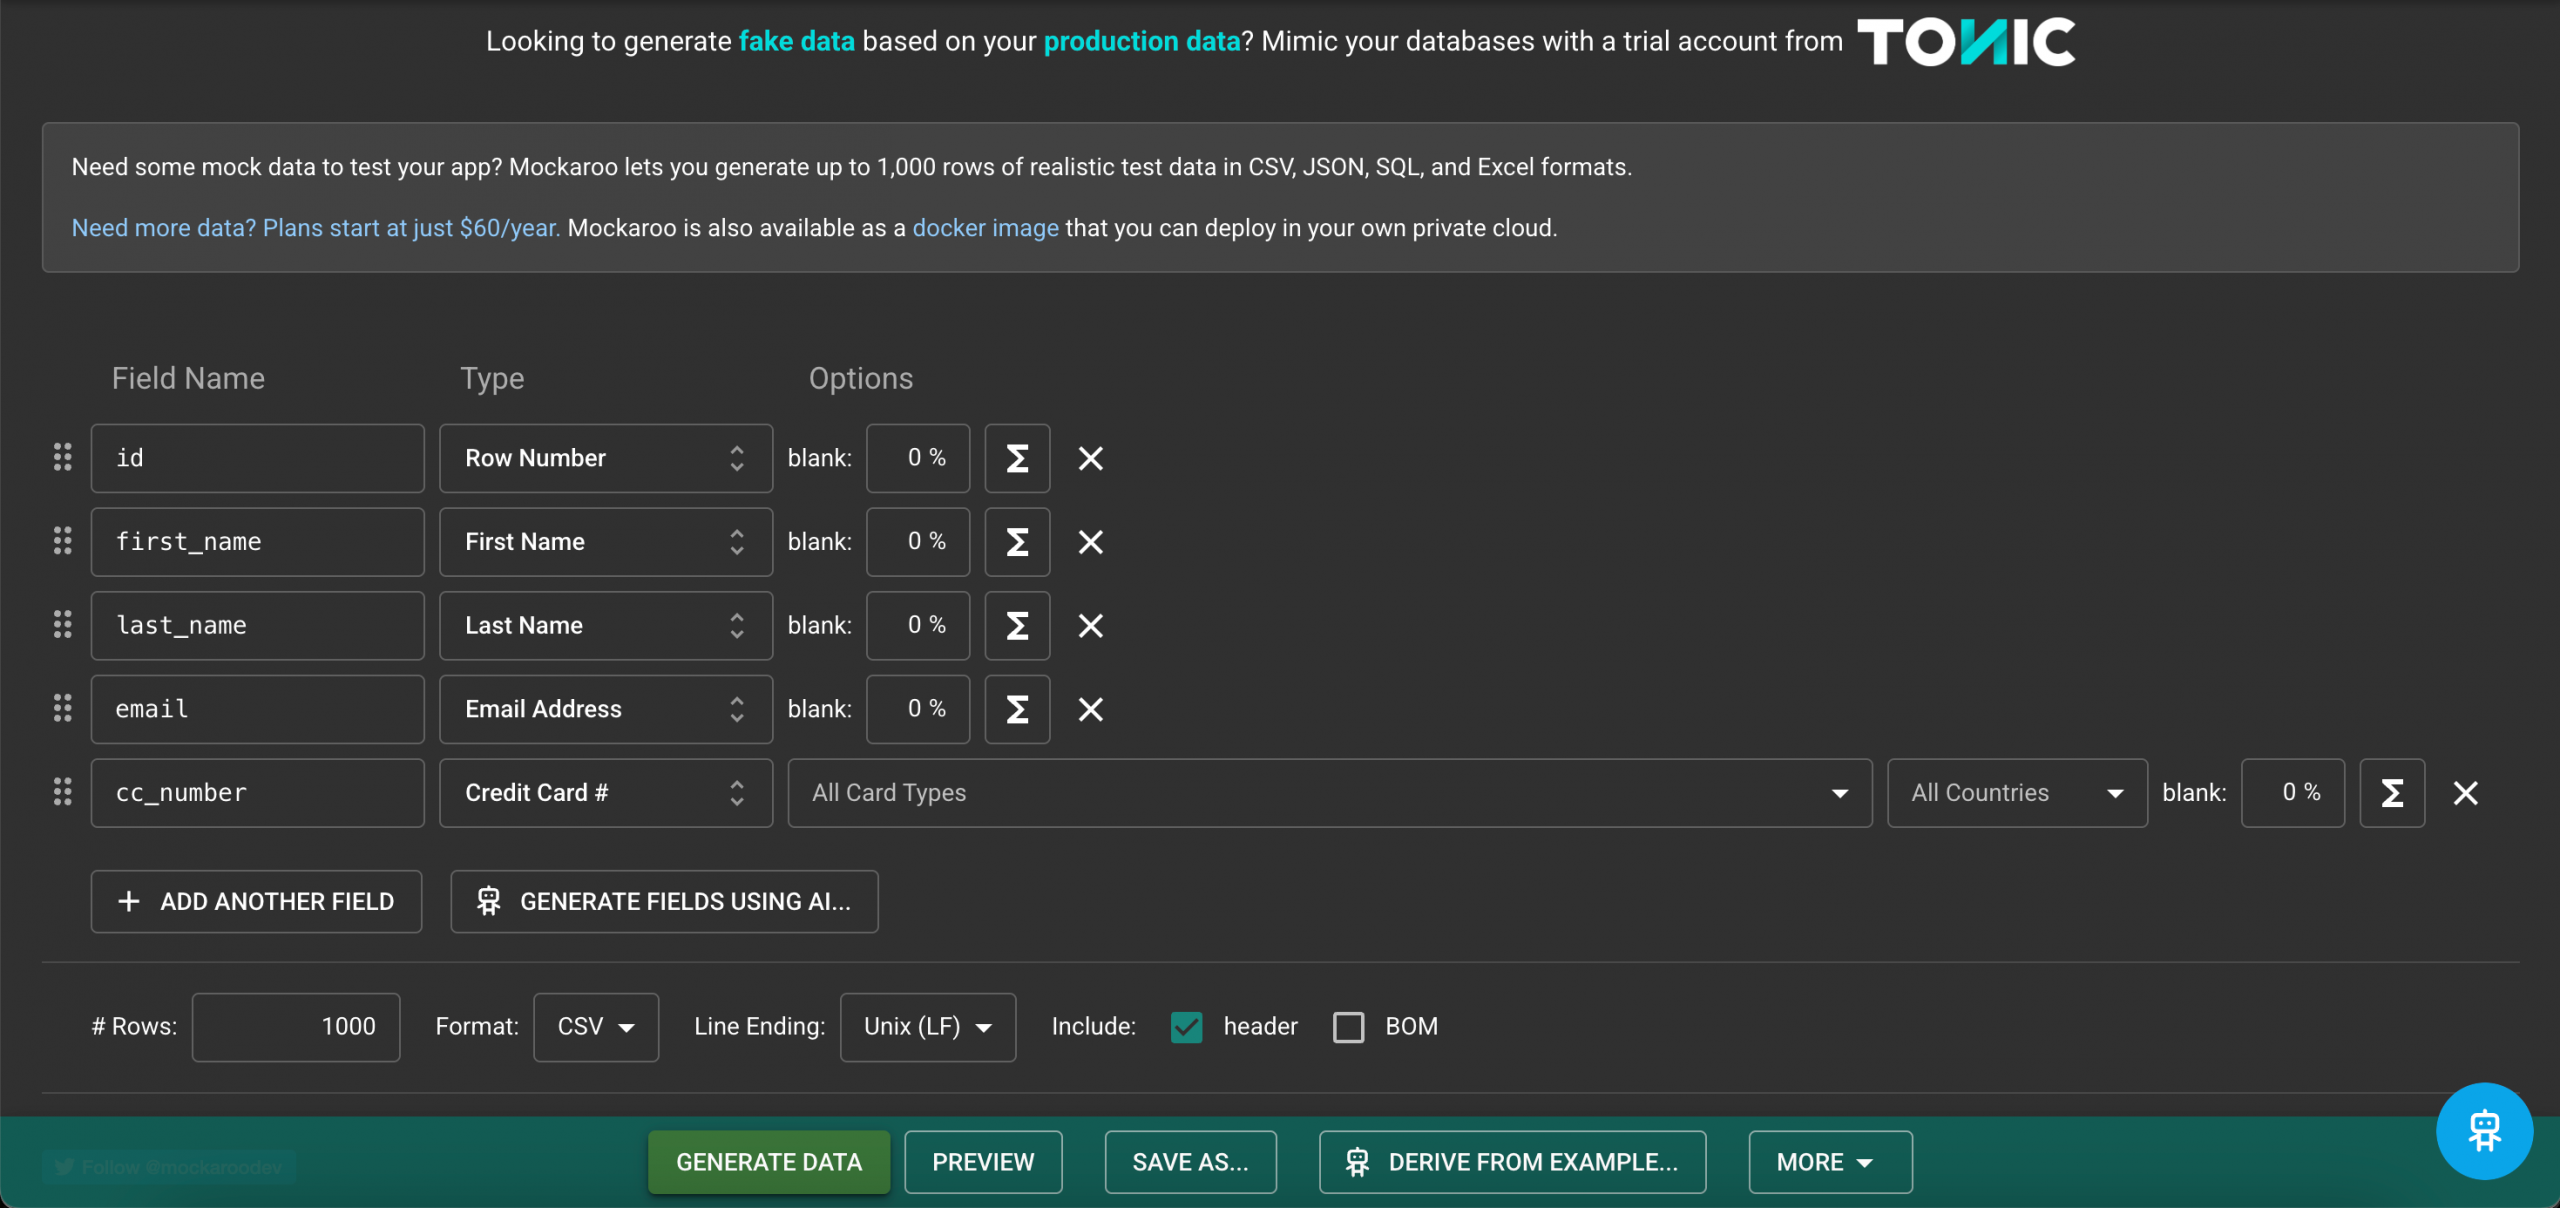
Need to generate data to prototype a dashboard or use in a presentation? Mockaroo is a user-friendly tool that will…
Need to capture a screenshot in Chrome but don’t want to pay for a tool like Snagit? Or does your…

I tend to write long blog posts, but it’s a pain to add a table of contents. Not anymore! Let…
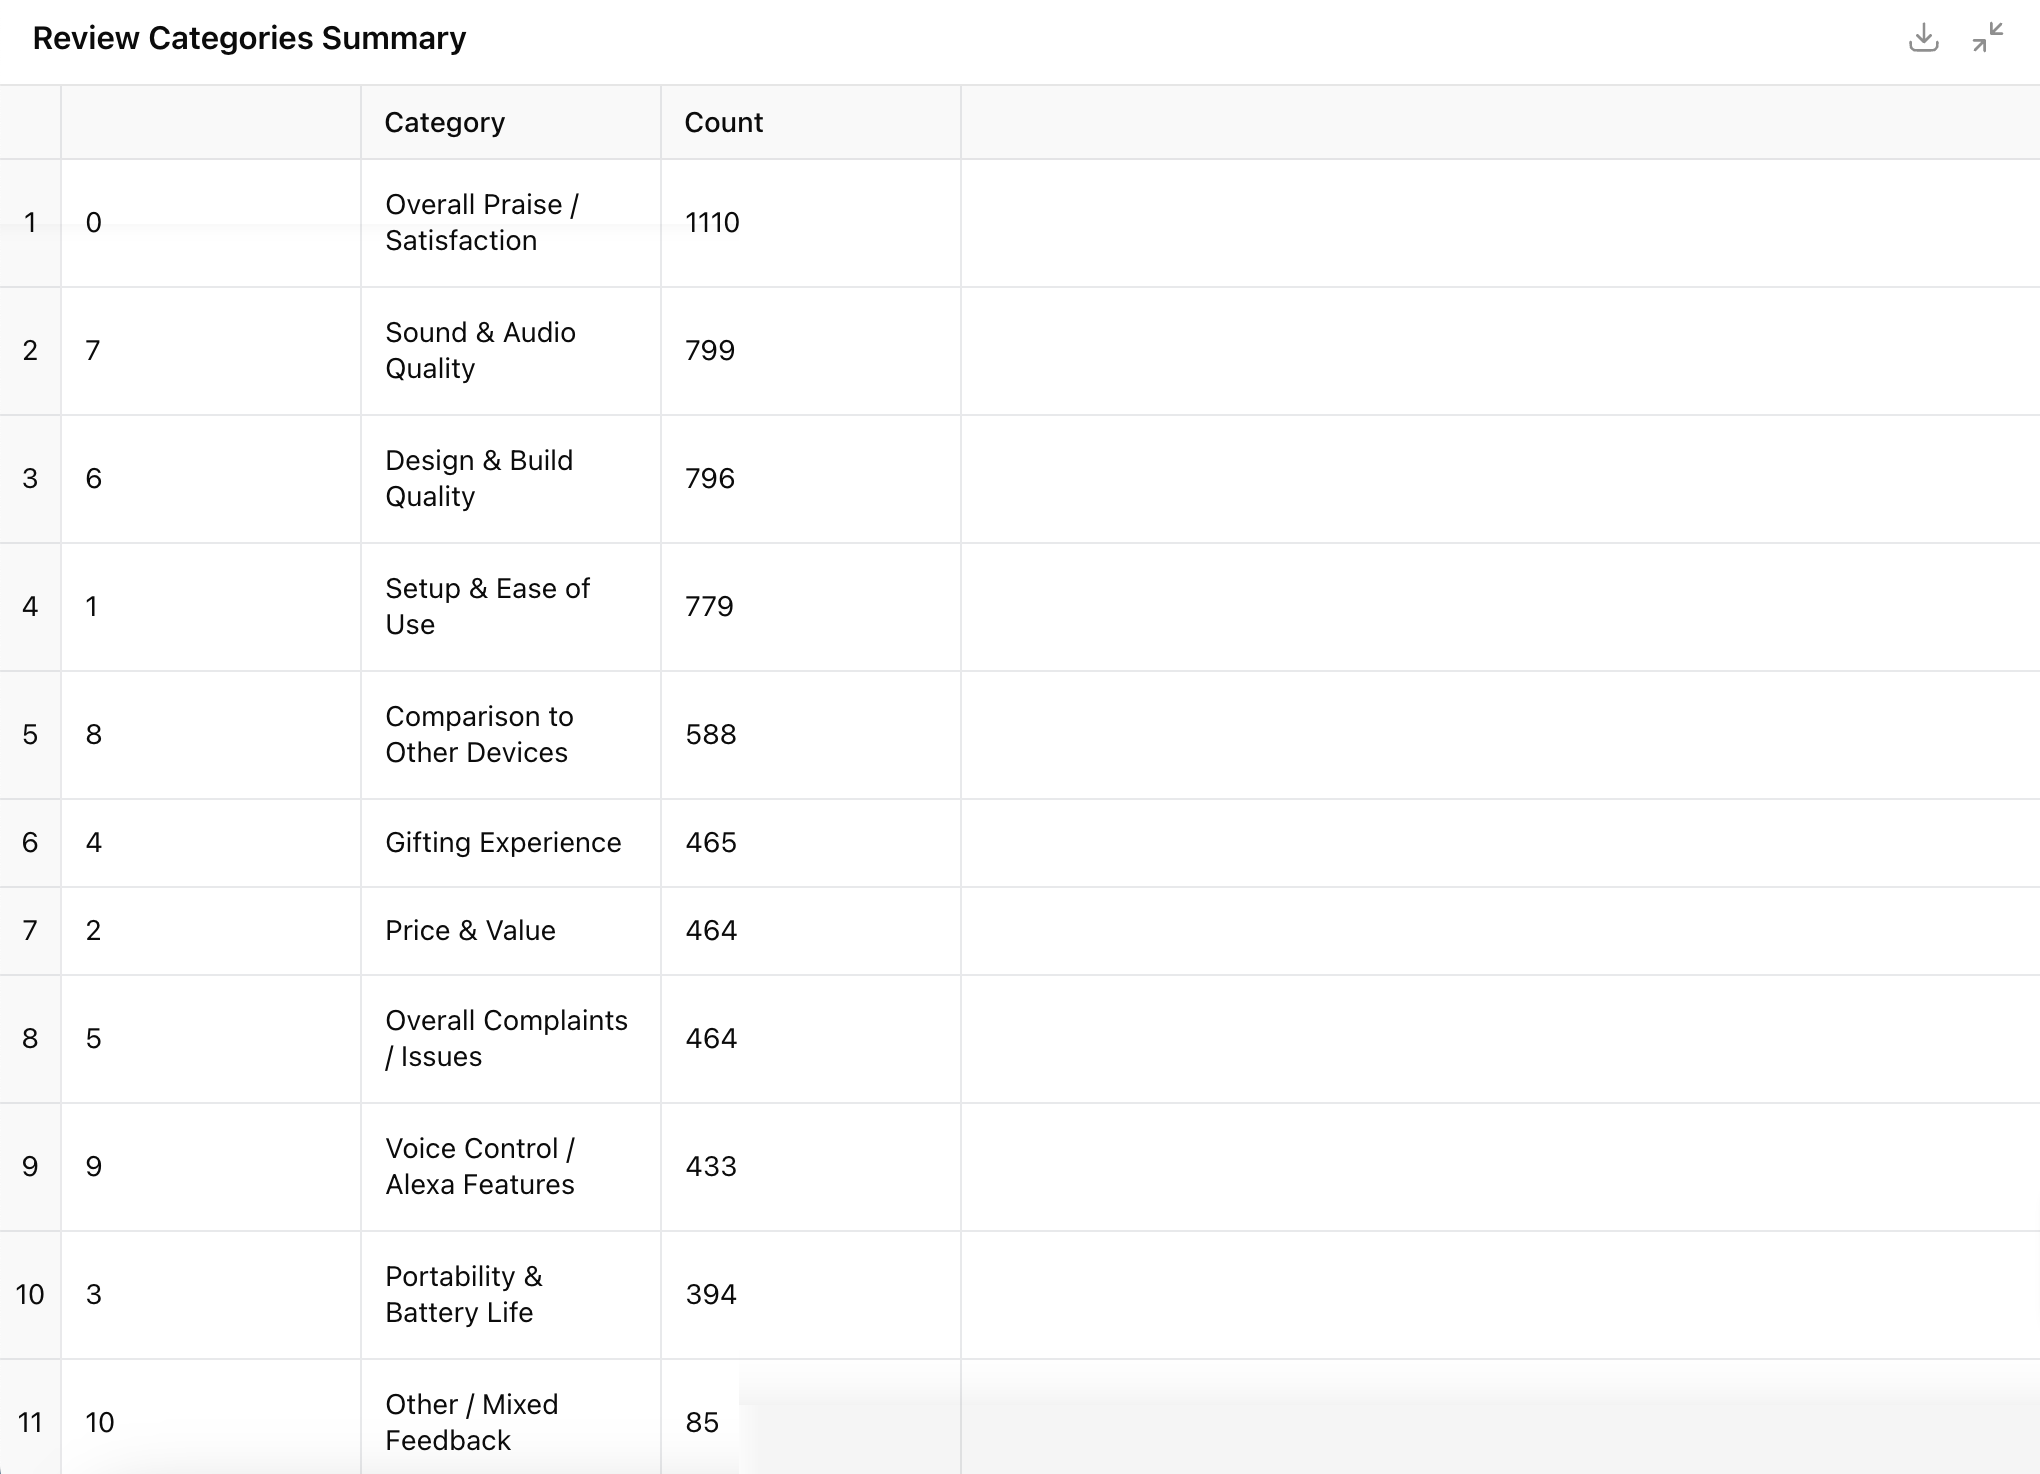
Prompt “Break these product reviews from column T into intuitive categories.” Source I used this Amazon Product Reviews Dataset from…
When I was redesigning my site and creating my interactive tools earlier this year (because I clearly undervalue protecting my…
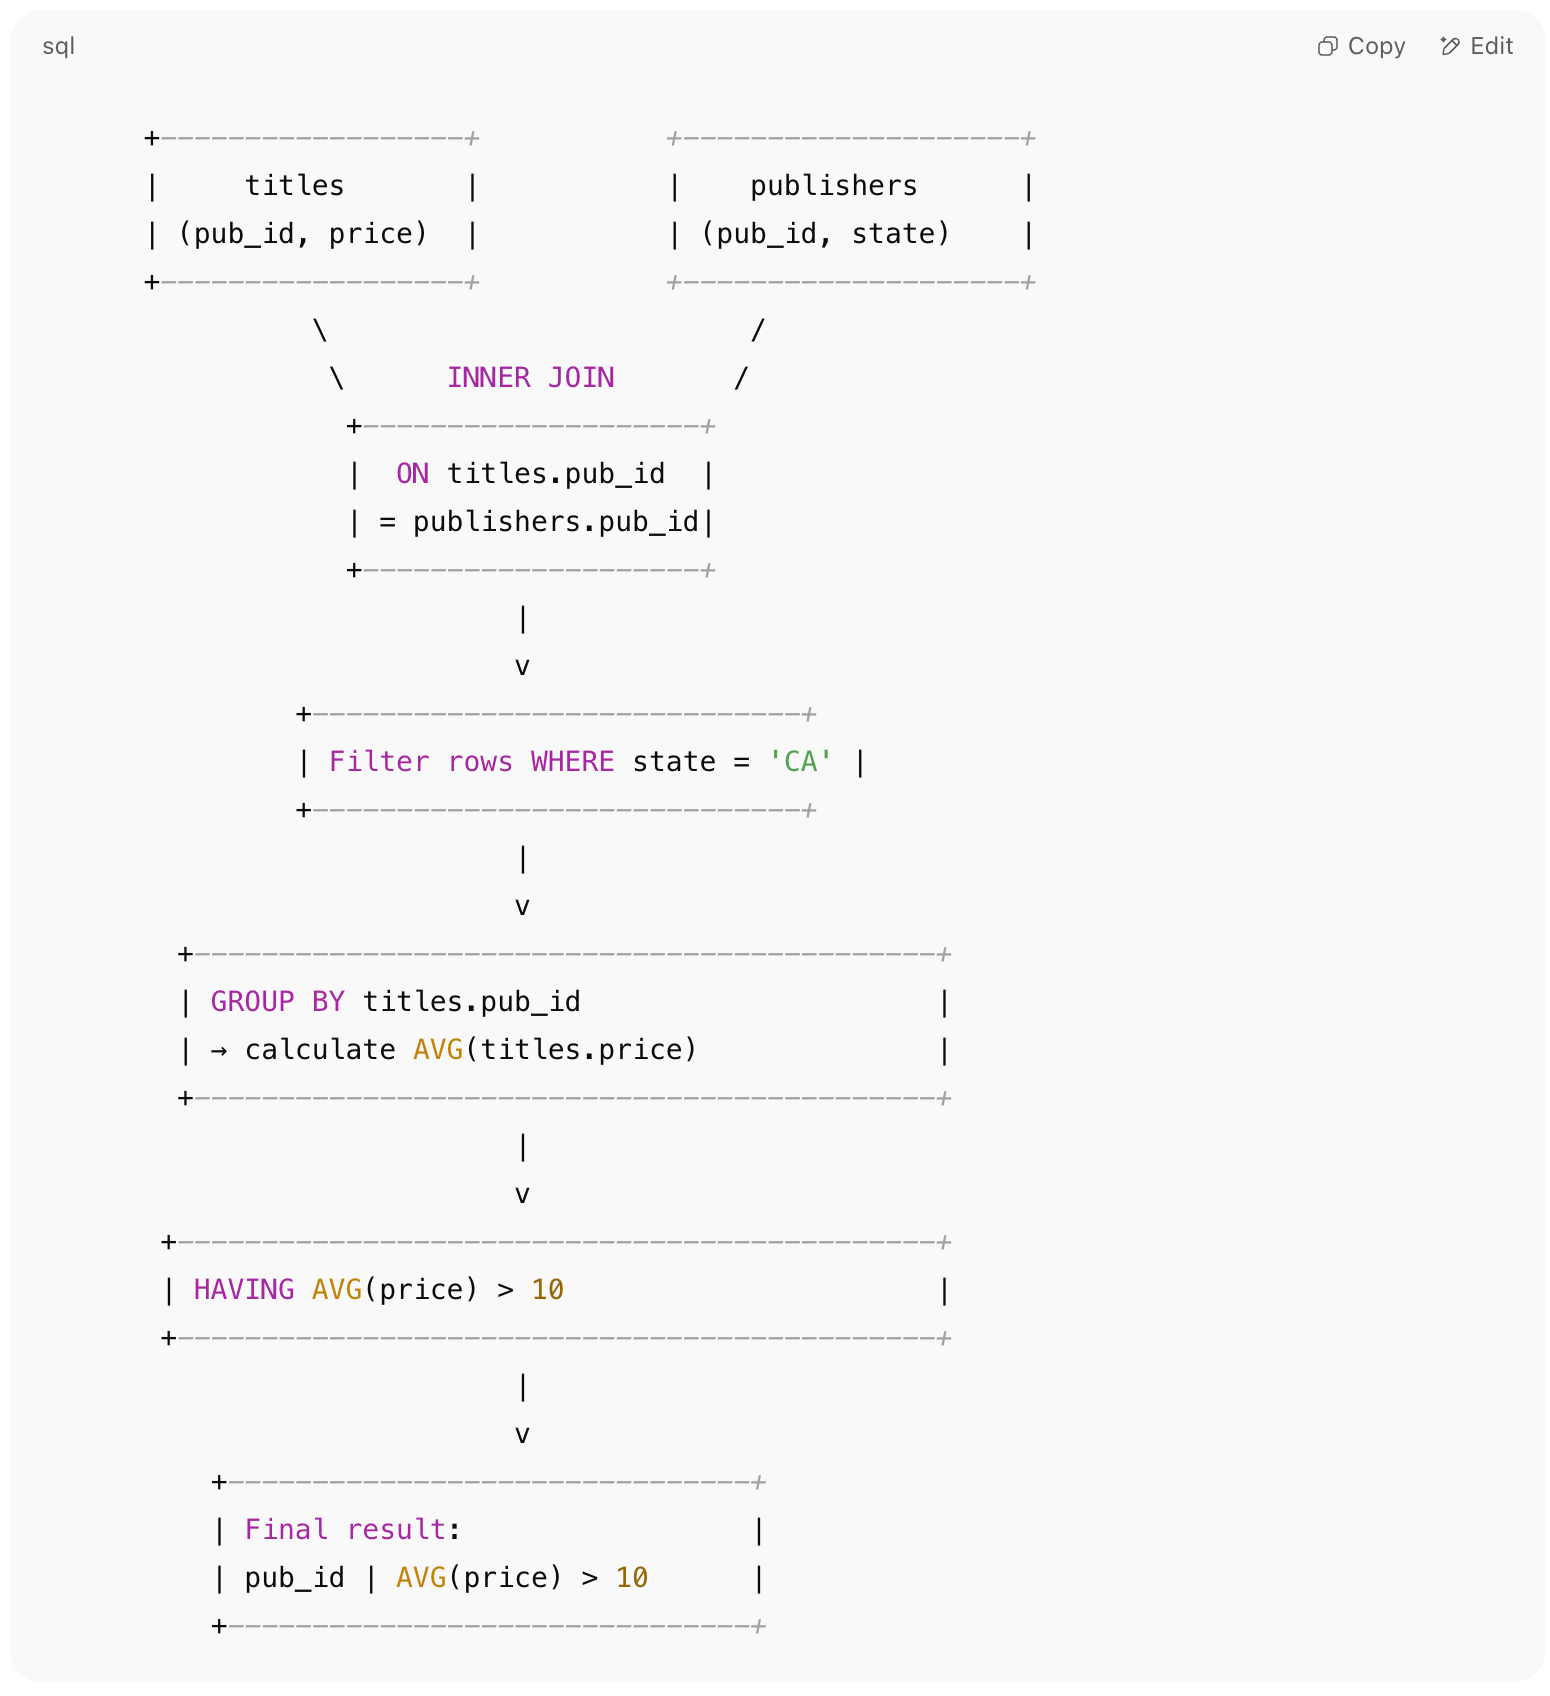
Prompt “Draw a simple visual with boxes and arrows that shows what this SQL query is doing—like a mini flowchart.”…