
A friend told me about a mobile homework app he was building out for his kids using the vibe-coding app, Cursor. In that convo, he mentioned that he wanted to add a speech-to-text component for them, so I told him I’d do some research and send him model recommendations. In less than 10 minutes, a clear winner emerged, and it was a free, open model: Canary Qwen. Let’s deconstruct how I arrived at that recommendation.
Step 1: Fire Up My AI Strategy App
Selecting the best model for a particular task requires getting really comfortable with AI model leaderboards. However, the problem with model leaderboards is they are all structured and formatted very differently. Most follow a predictable pattern of tables with sorted lists of models. However, few explain their metrics (aka benchmarks) and those that do often bury them in an Arxiv paper or blog post (with, of course, no link to said paper or post).
I spent about a month immersing myself in these leaderboards and organizing them into categories and subcategories. When I decided to convert my sprawling Google Sheet into an app, those columns became the filters for the app.
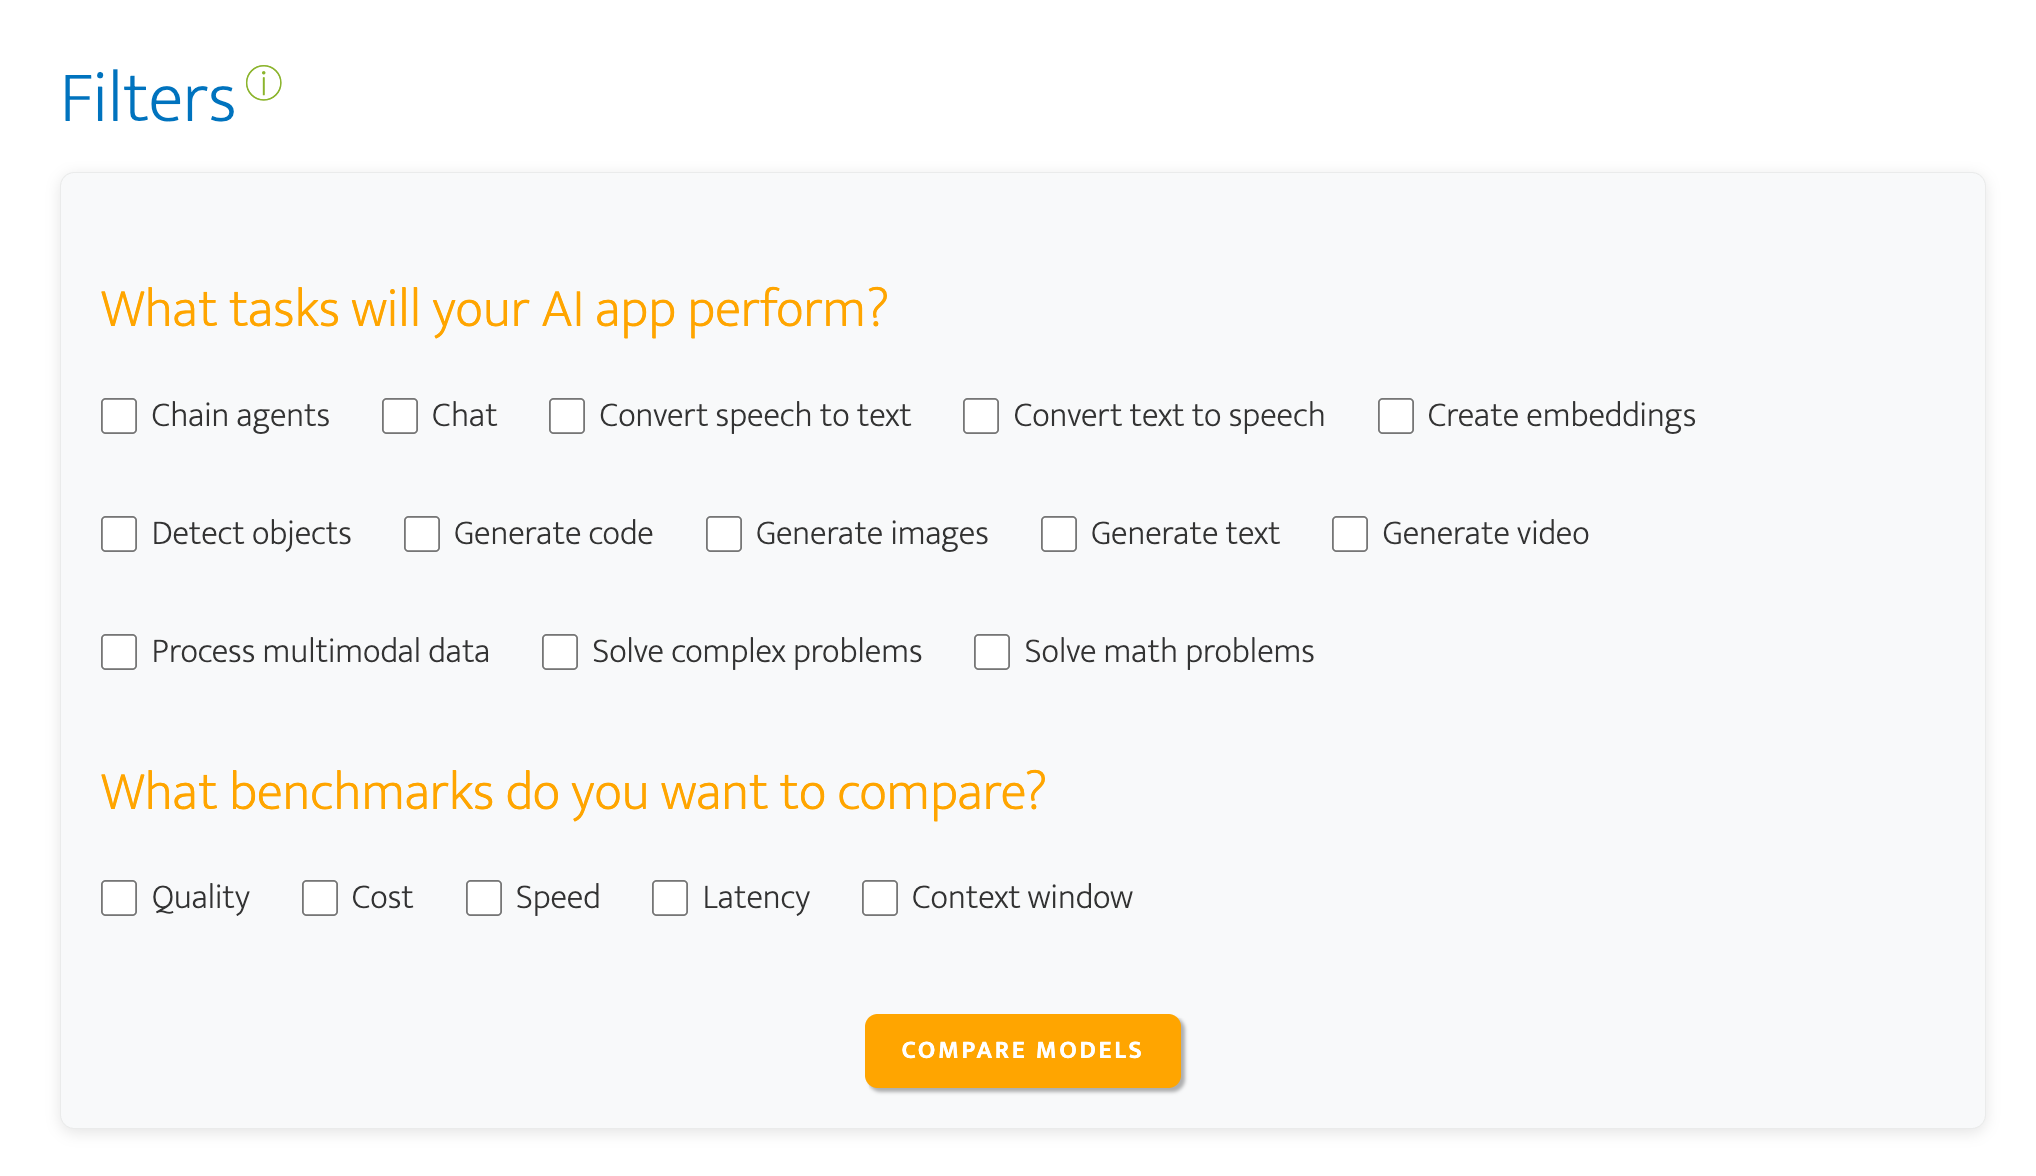
For this project, since speed wasn’t an issue, I selected ‘Convert speech to text’ for the task and ‘Quality’ and ‘Cost’ for the benchmarks (link to filtered view).
These nodes normally get pretty tangled up. I actually find it cathartic to rearrange them. It’s like a fidget spinner for engineers. 😂 But this time all I had to do was tweak the orientation to set the Model hub node to north. Okay, technically I didn’t need to realign the chart, but I always do because it’s a compulsion.

The green nodes are the leaderboards you can use to evaluate the coupled task and goal you selected. To wit, you can use Open ASR and Artificial Analysis (AA) to evaluate the quality of these models and Artificial Analysis to compare costs. The gray nodes provide a sneak peek at the benchmarks you will find when you click through to a leaderboard, but they are also included in the leaderboard modal, which you summon by clicking on a leaderboard (green) node. There you will be able to access a summary of the leaderboard, as well as links, tips, and benchmark definitions. The tips are the result of that month I spent spelunking. 🤿🔱⚱️
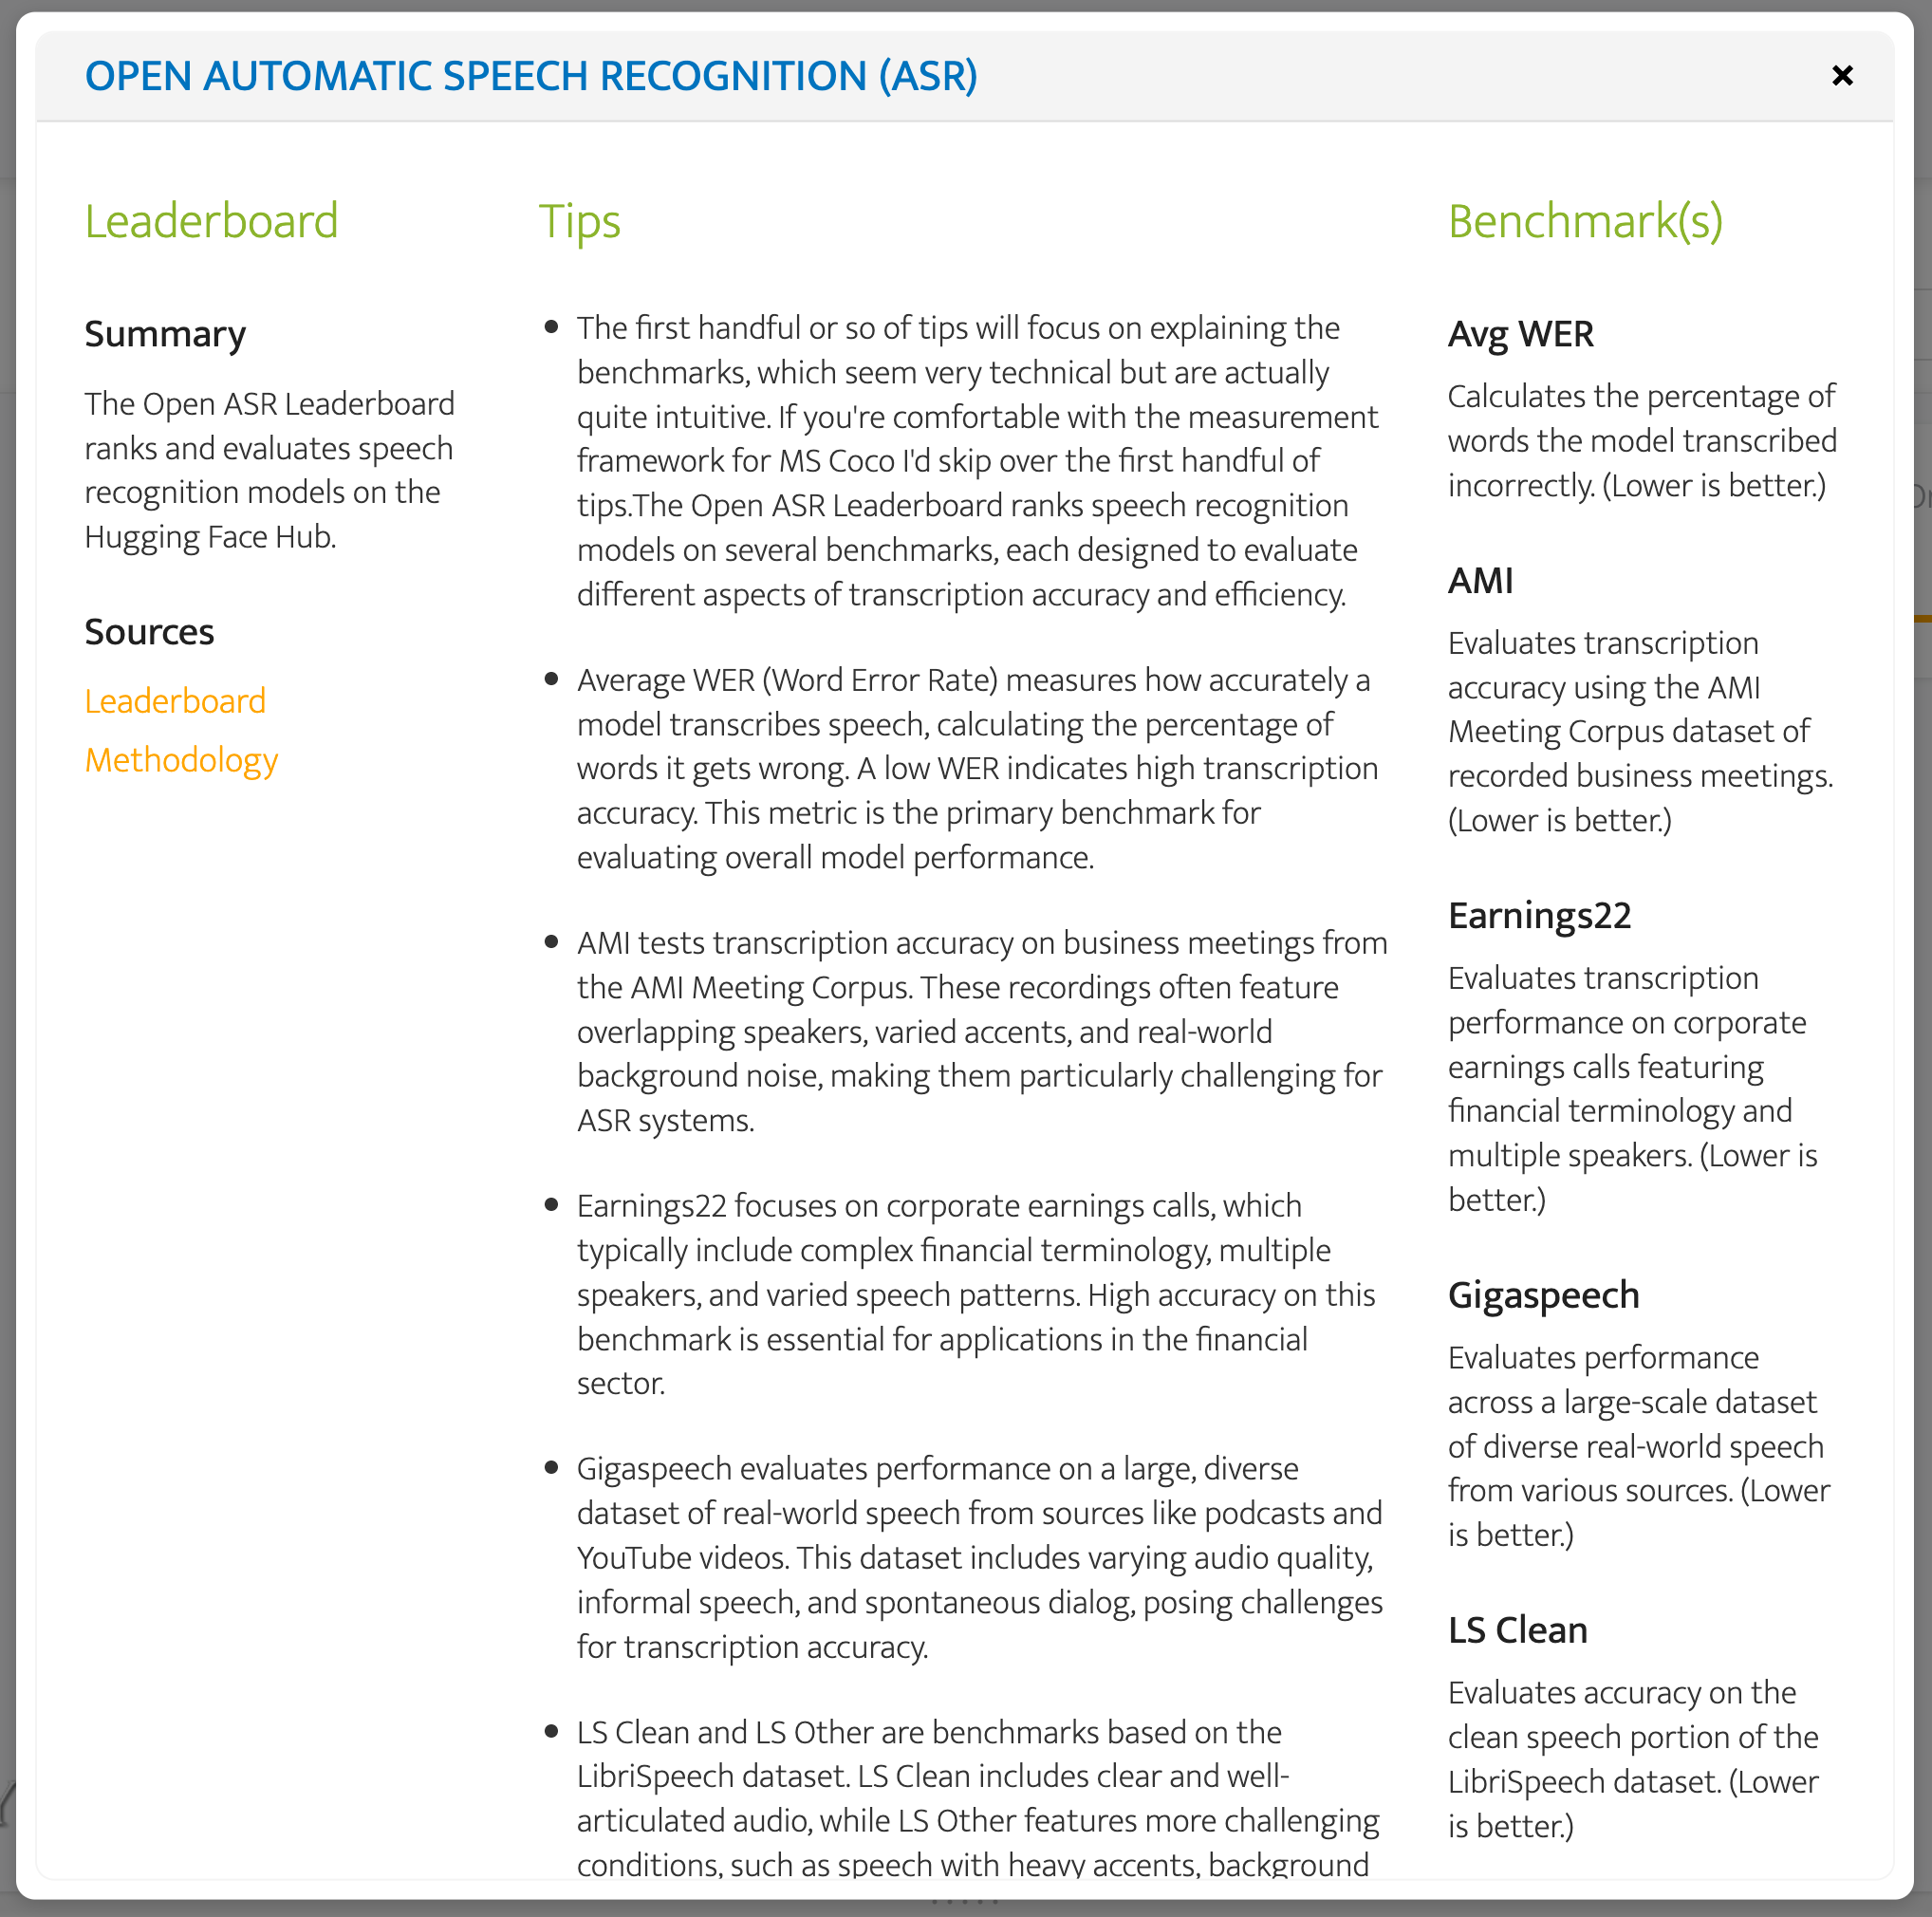
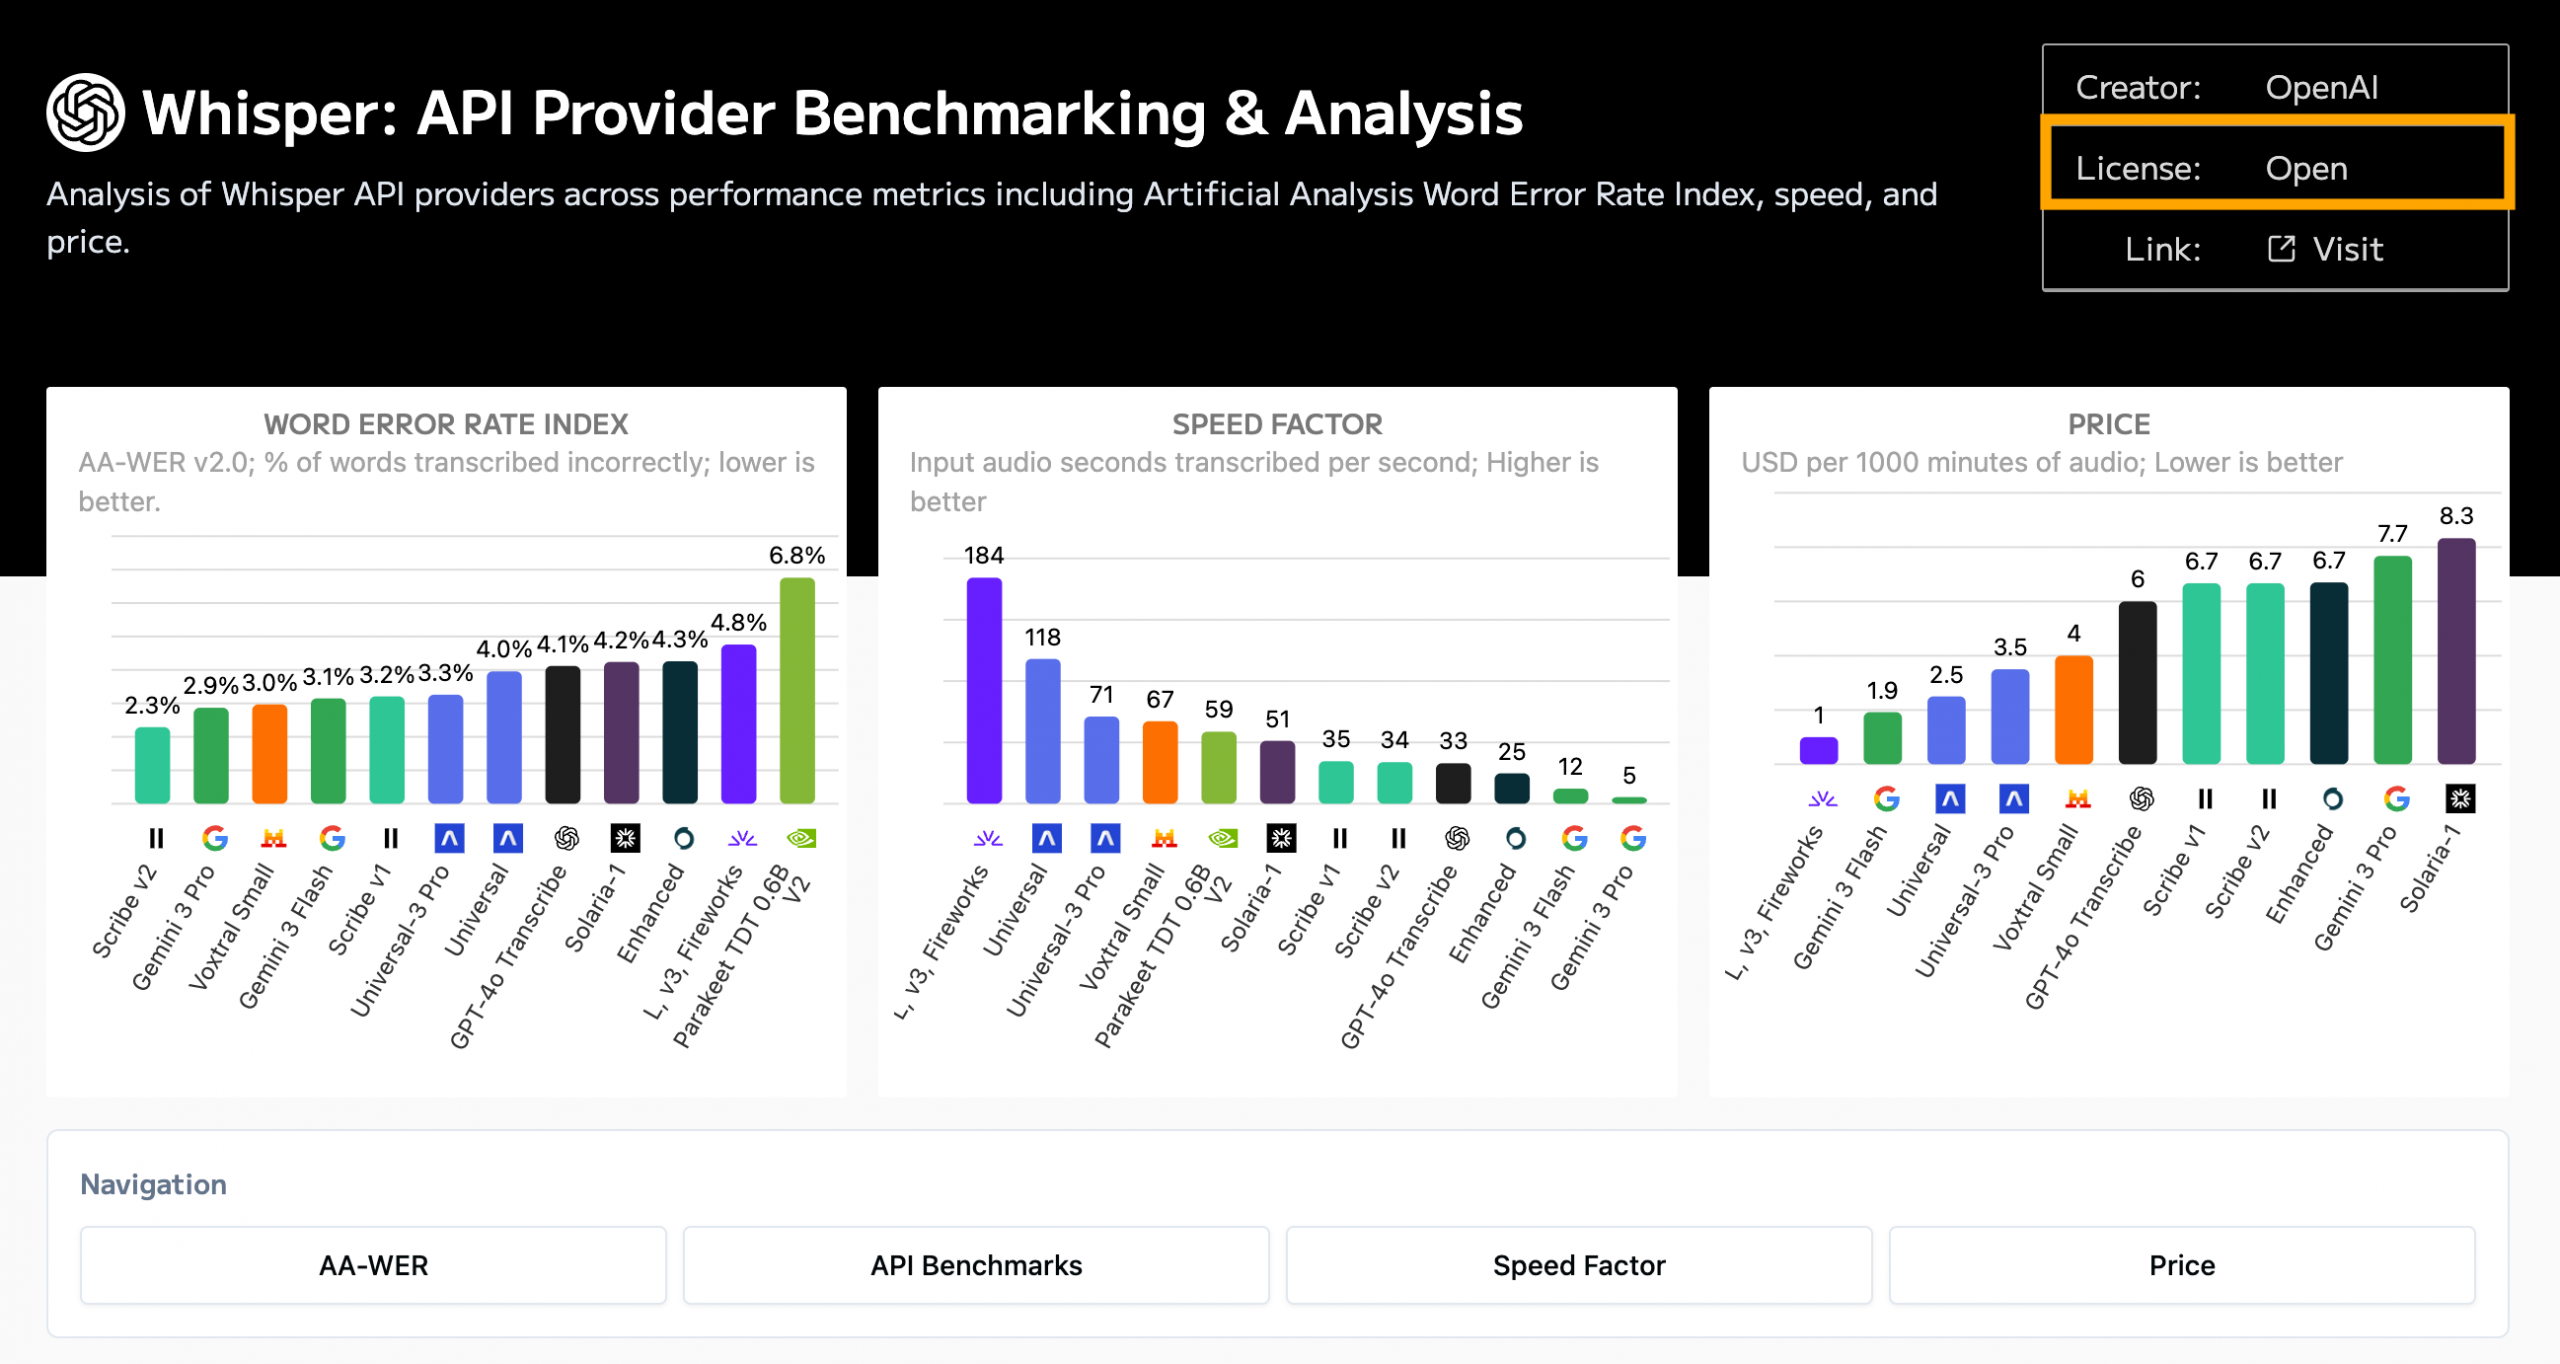
I used the Open ASR leaderboard modal because it includes many more benchmarks, while AA focuses exclusively on word error rate (WER)**.
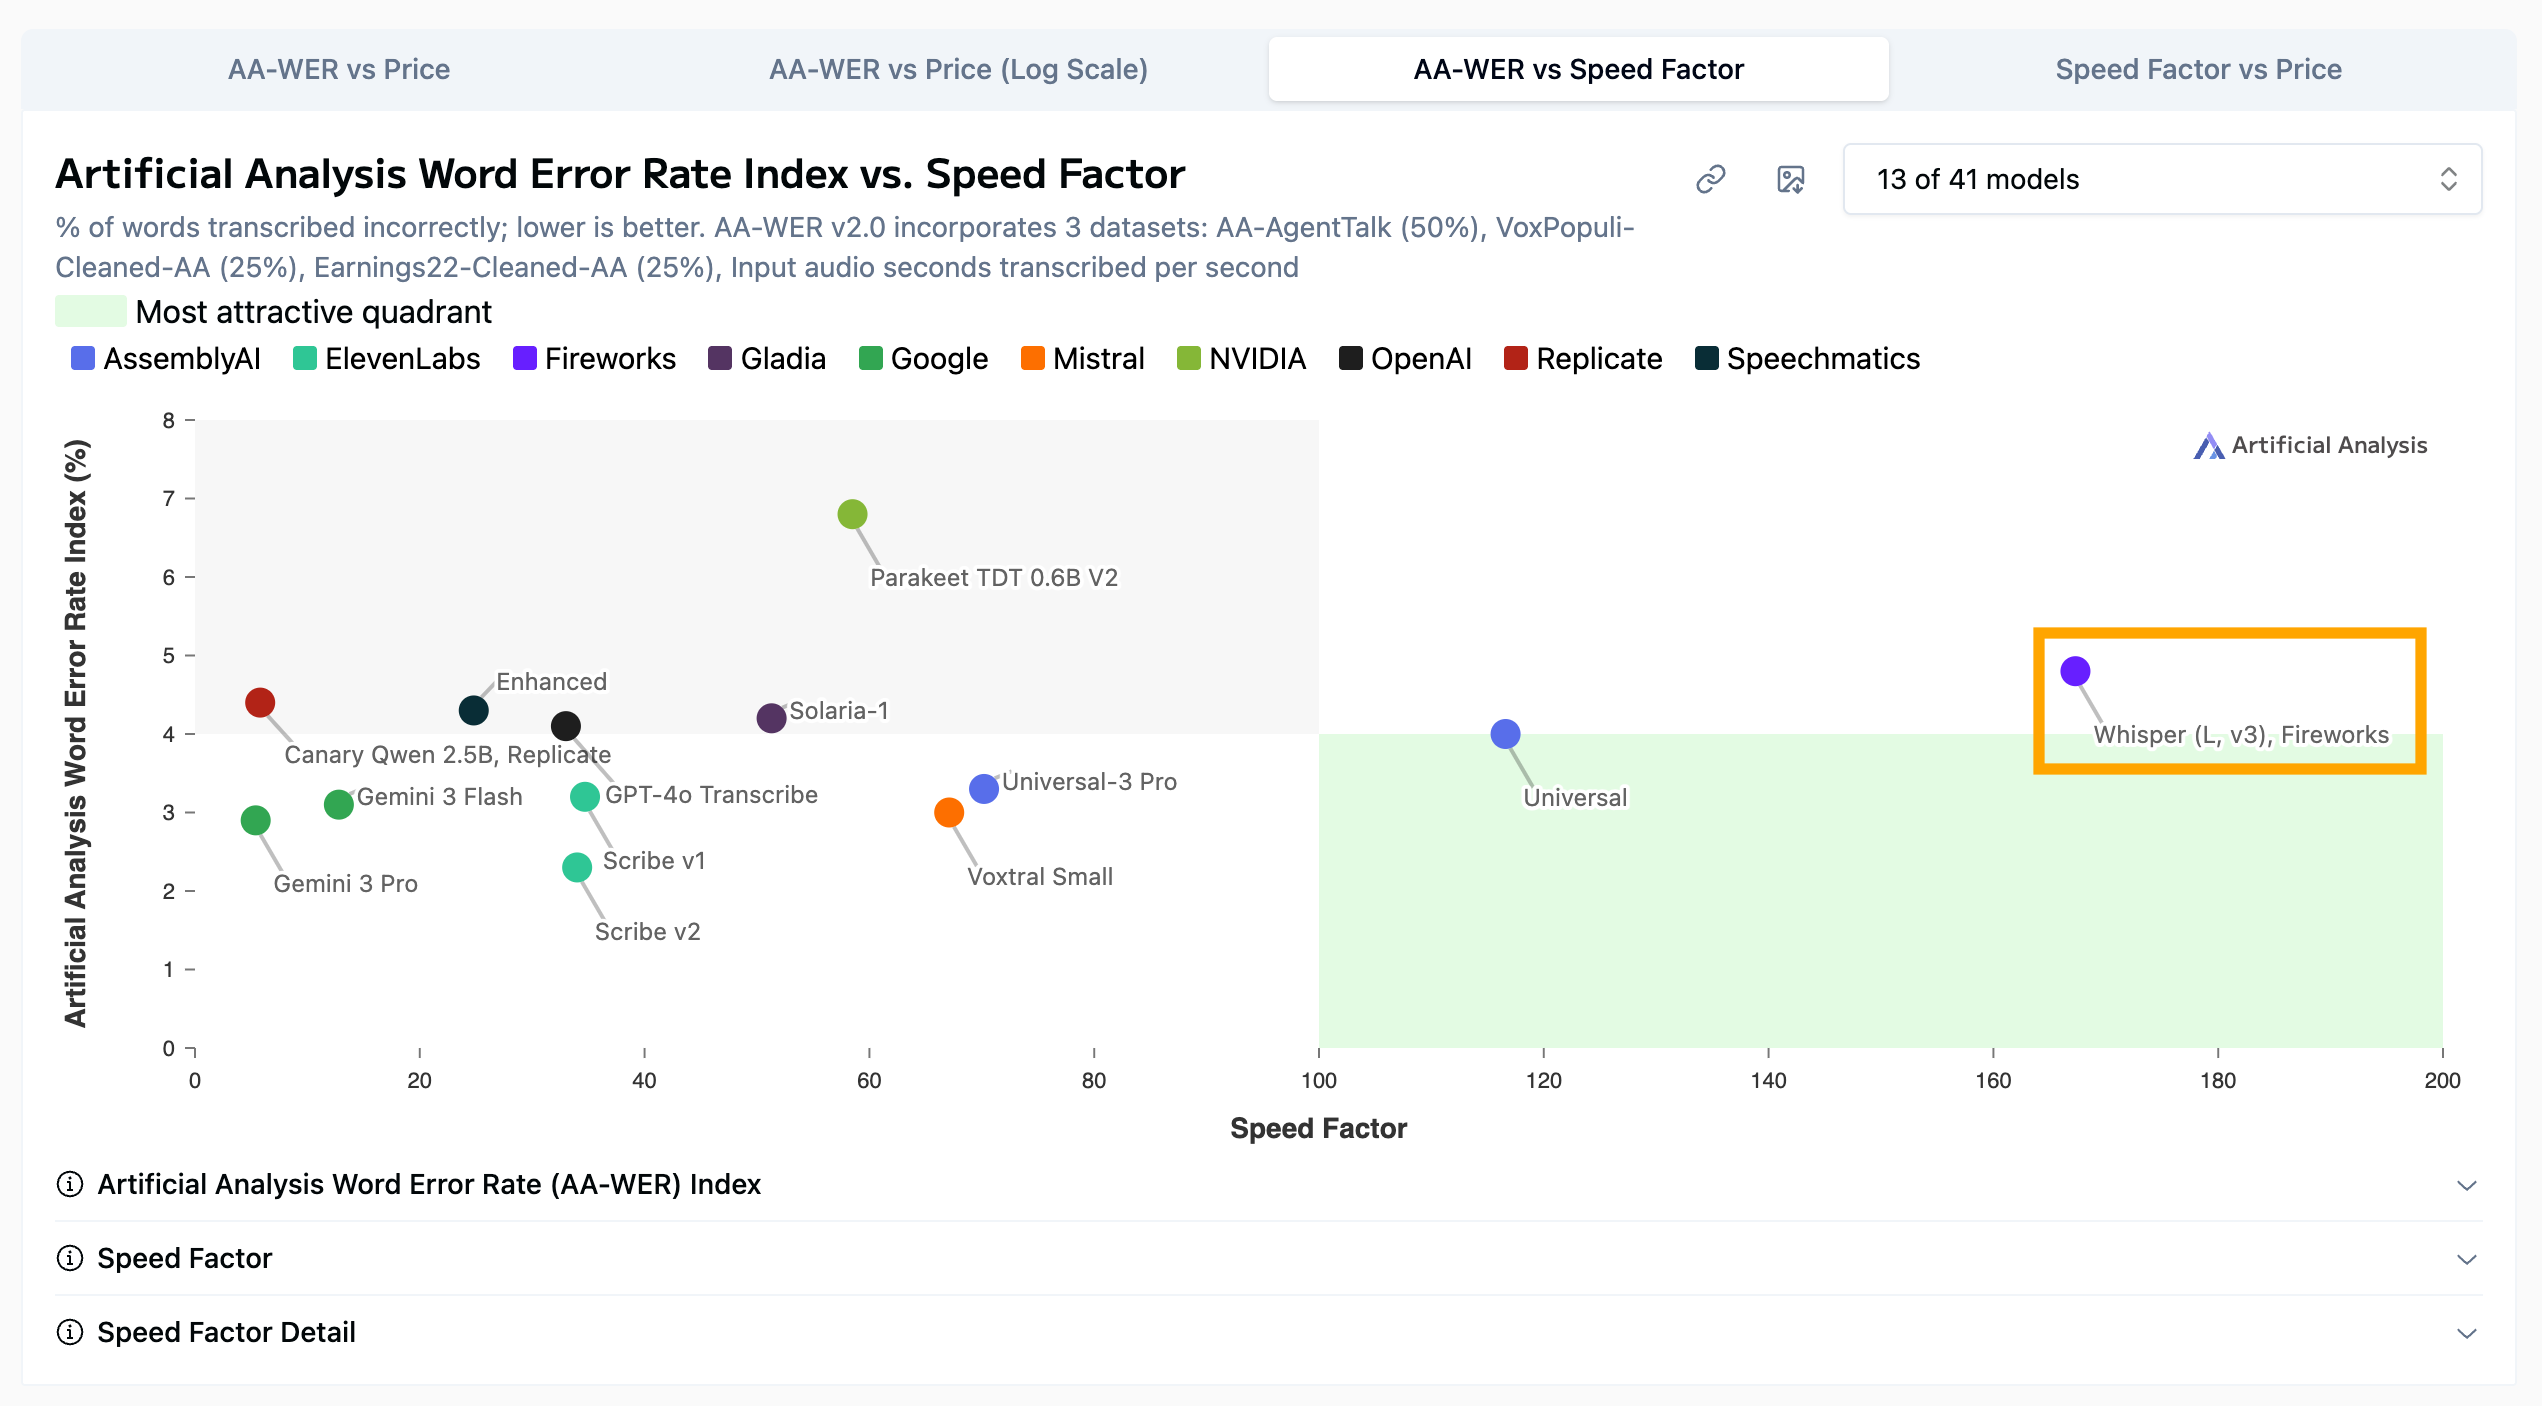
But what I love about AA (which I probably mention in every post about picking AI models) is that it has charts, where most of the leaderboards sport tables. And it almost always offers a scatterplot that compares cost and quality, which in most cases is leaderboard Nirvana. 💫
** WER measures transcription accuracy by calculating the percentage of words that are inserted, deleted, or substituted compared to the correct transcript. Lower values mean better performance.
Step 2: Compare Model Performance
I know from working with the AA leaderboards that they only show some of the models you can actually choose from. I strongly encourage you to use their model filter (upper-right corner of the chart) to broaden your analysis. I only included Amazon’s Transcribe and Google’s Chirp models in this image to demonstrate the supreme importance of doing this research before committing to a model.
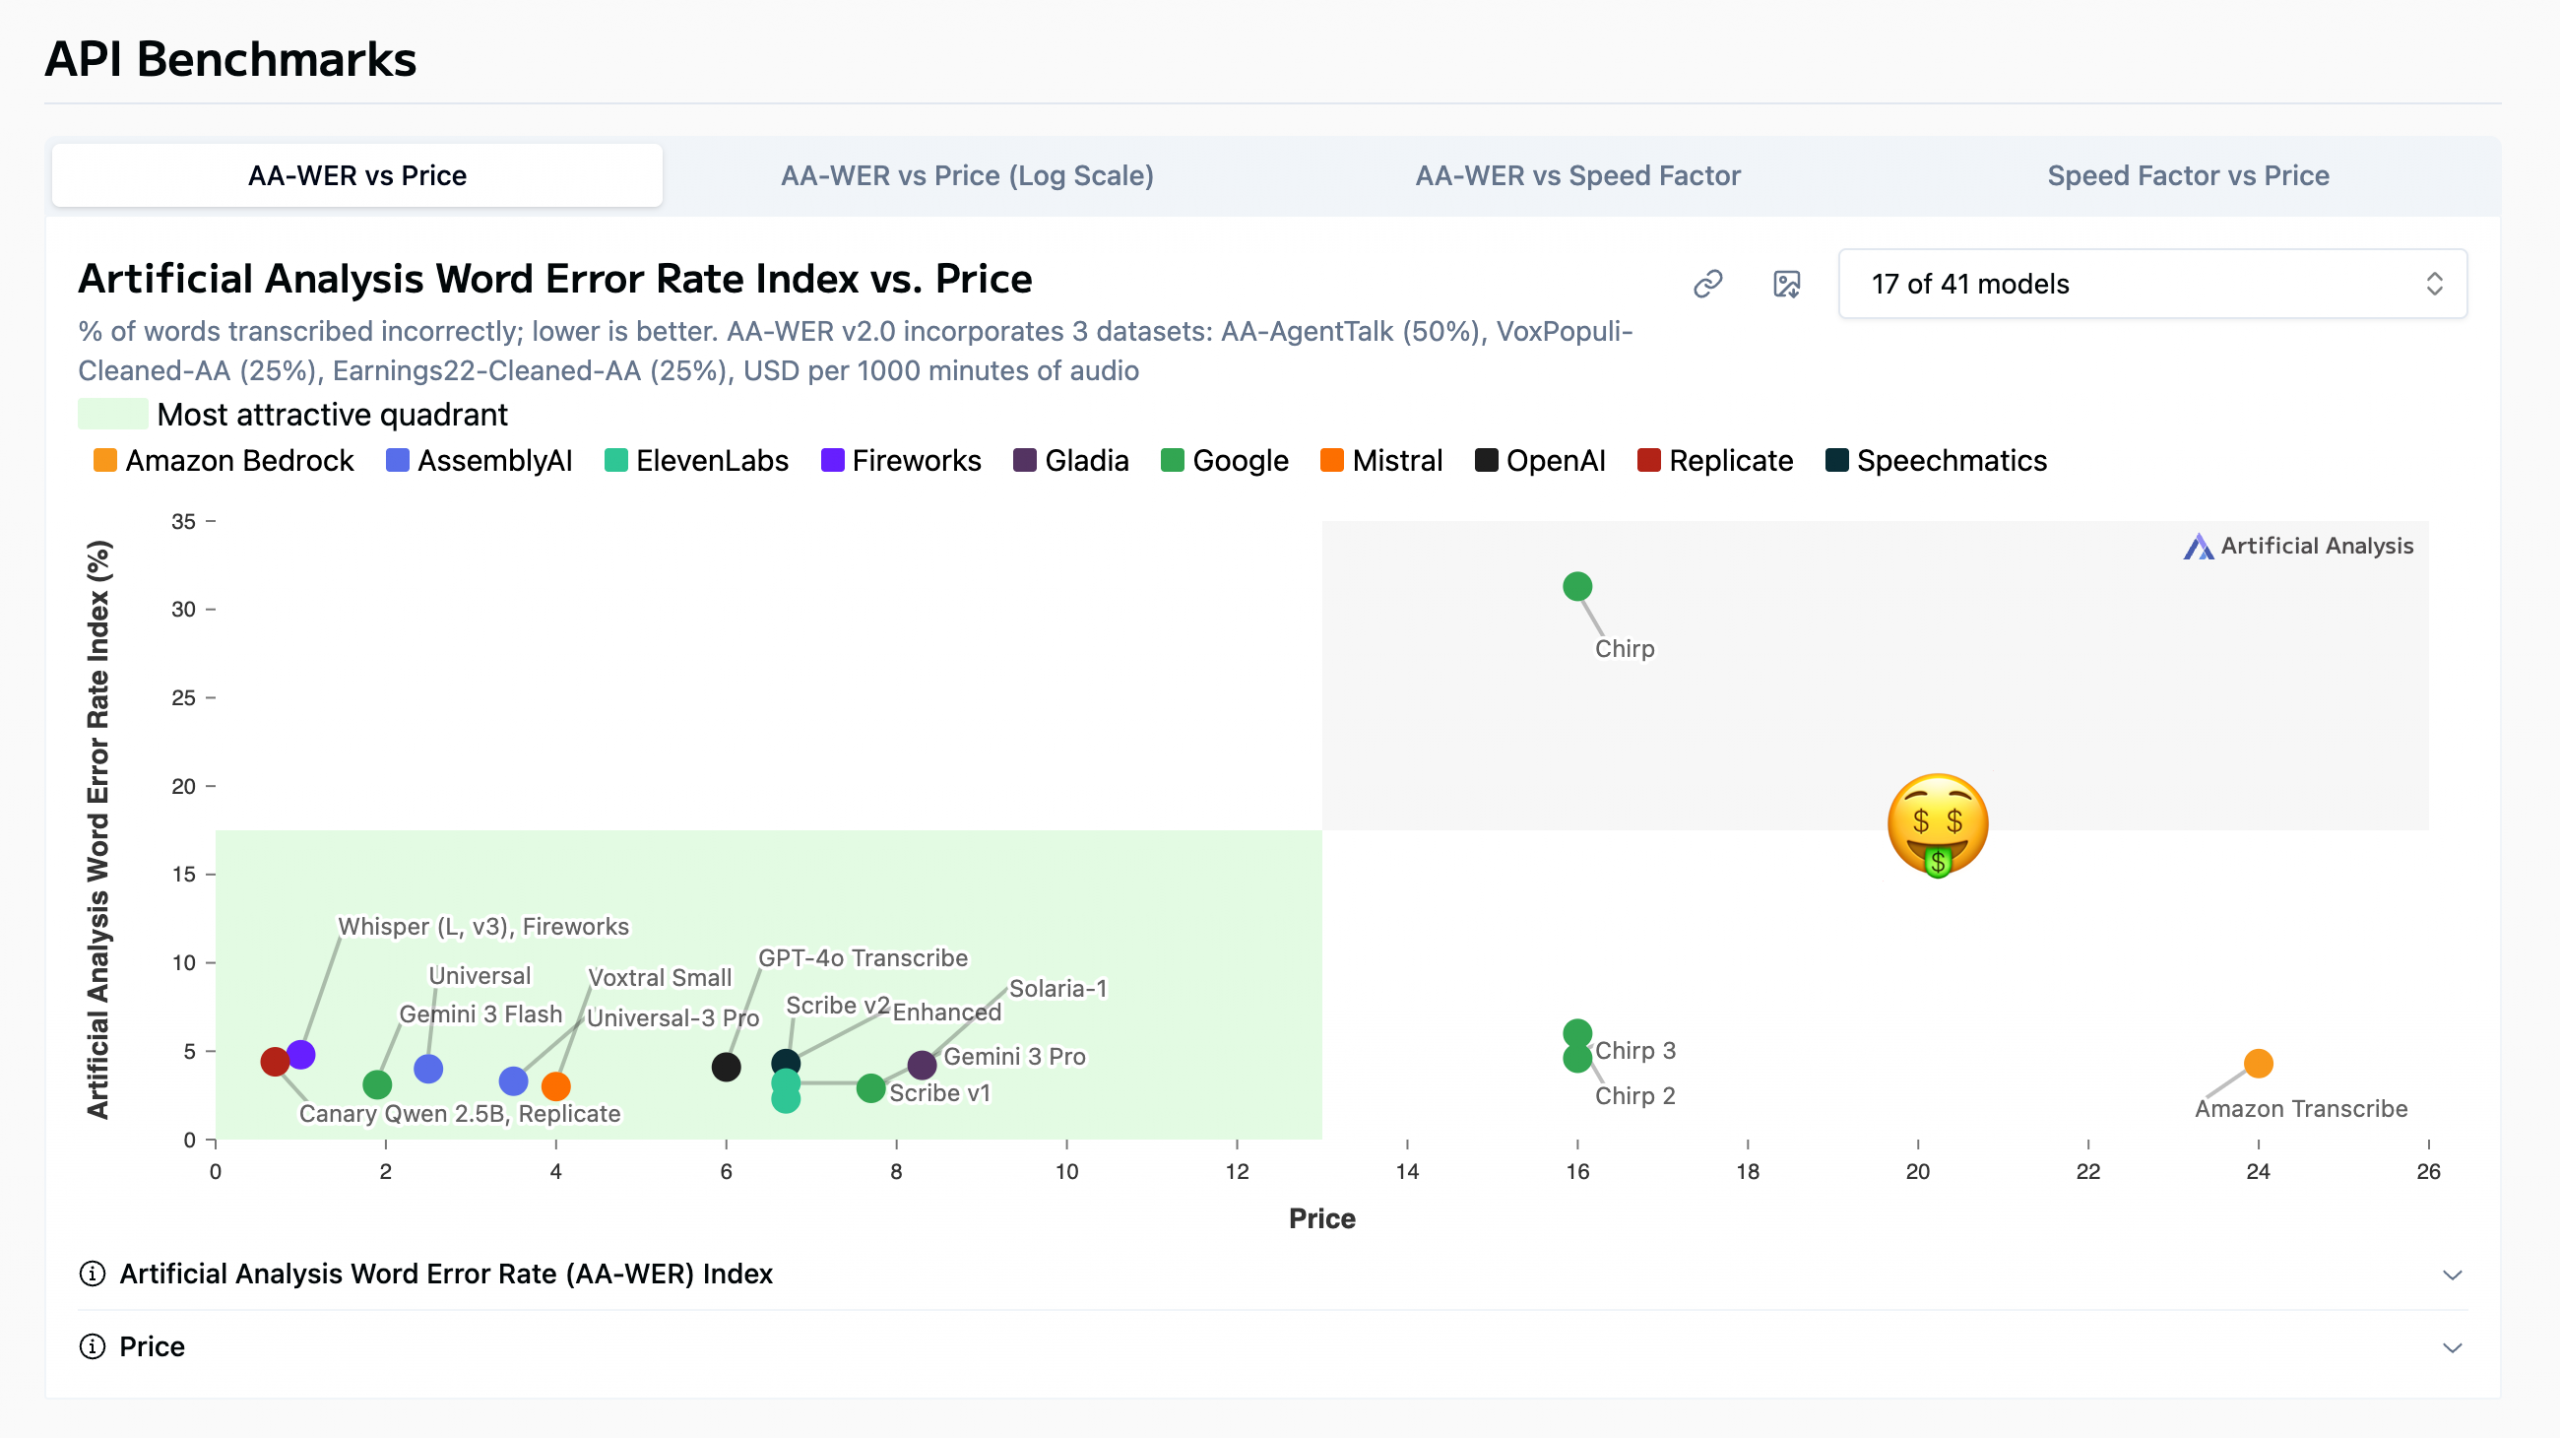
Chirp is in AA’s dreaded gray zone because it is the worst of both worlds: high cost and low quality.
Clearly Google addressed these quality issues with its subsequent models, but their cost per 1,000 minutes of audio transcribed (USD) is still quite high, especially when you compare it to some models with comparable or higher quality that are a fraction of the price (which are chilling in AA’s green quadrant).
Caveat: These cost values are approximates, not actual costs. AA estimates cost by simulating a typical model request rather than comparing raw pricing tables. For speech-to-text transcription models, this is usually expressed as the estimated cost per 1,000 minutes of audio processed, based on the provider’s published pricing.
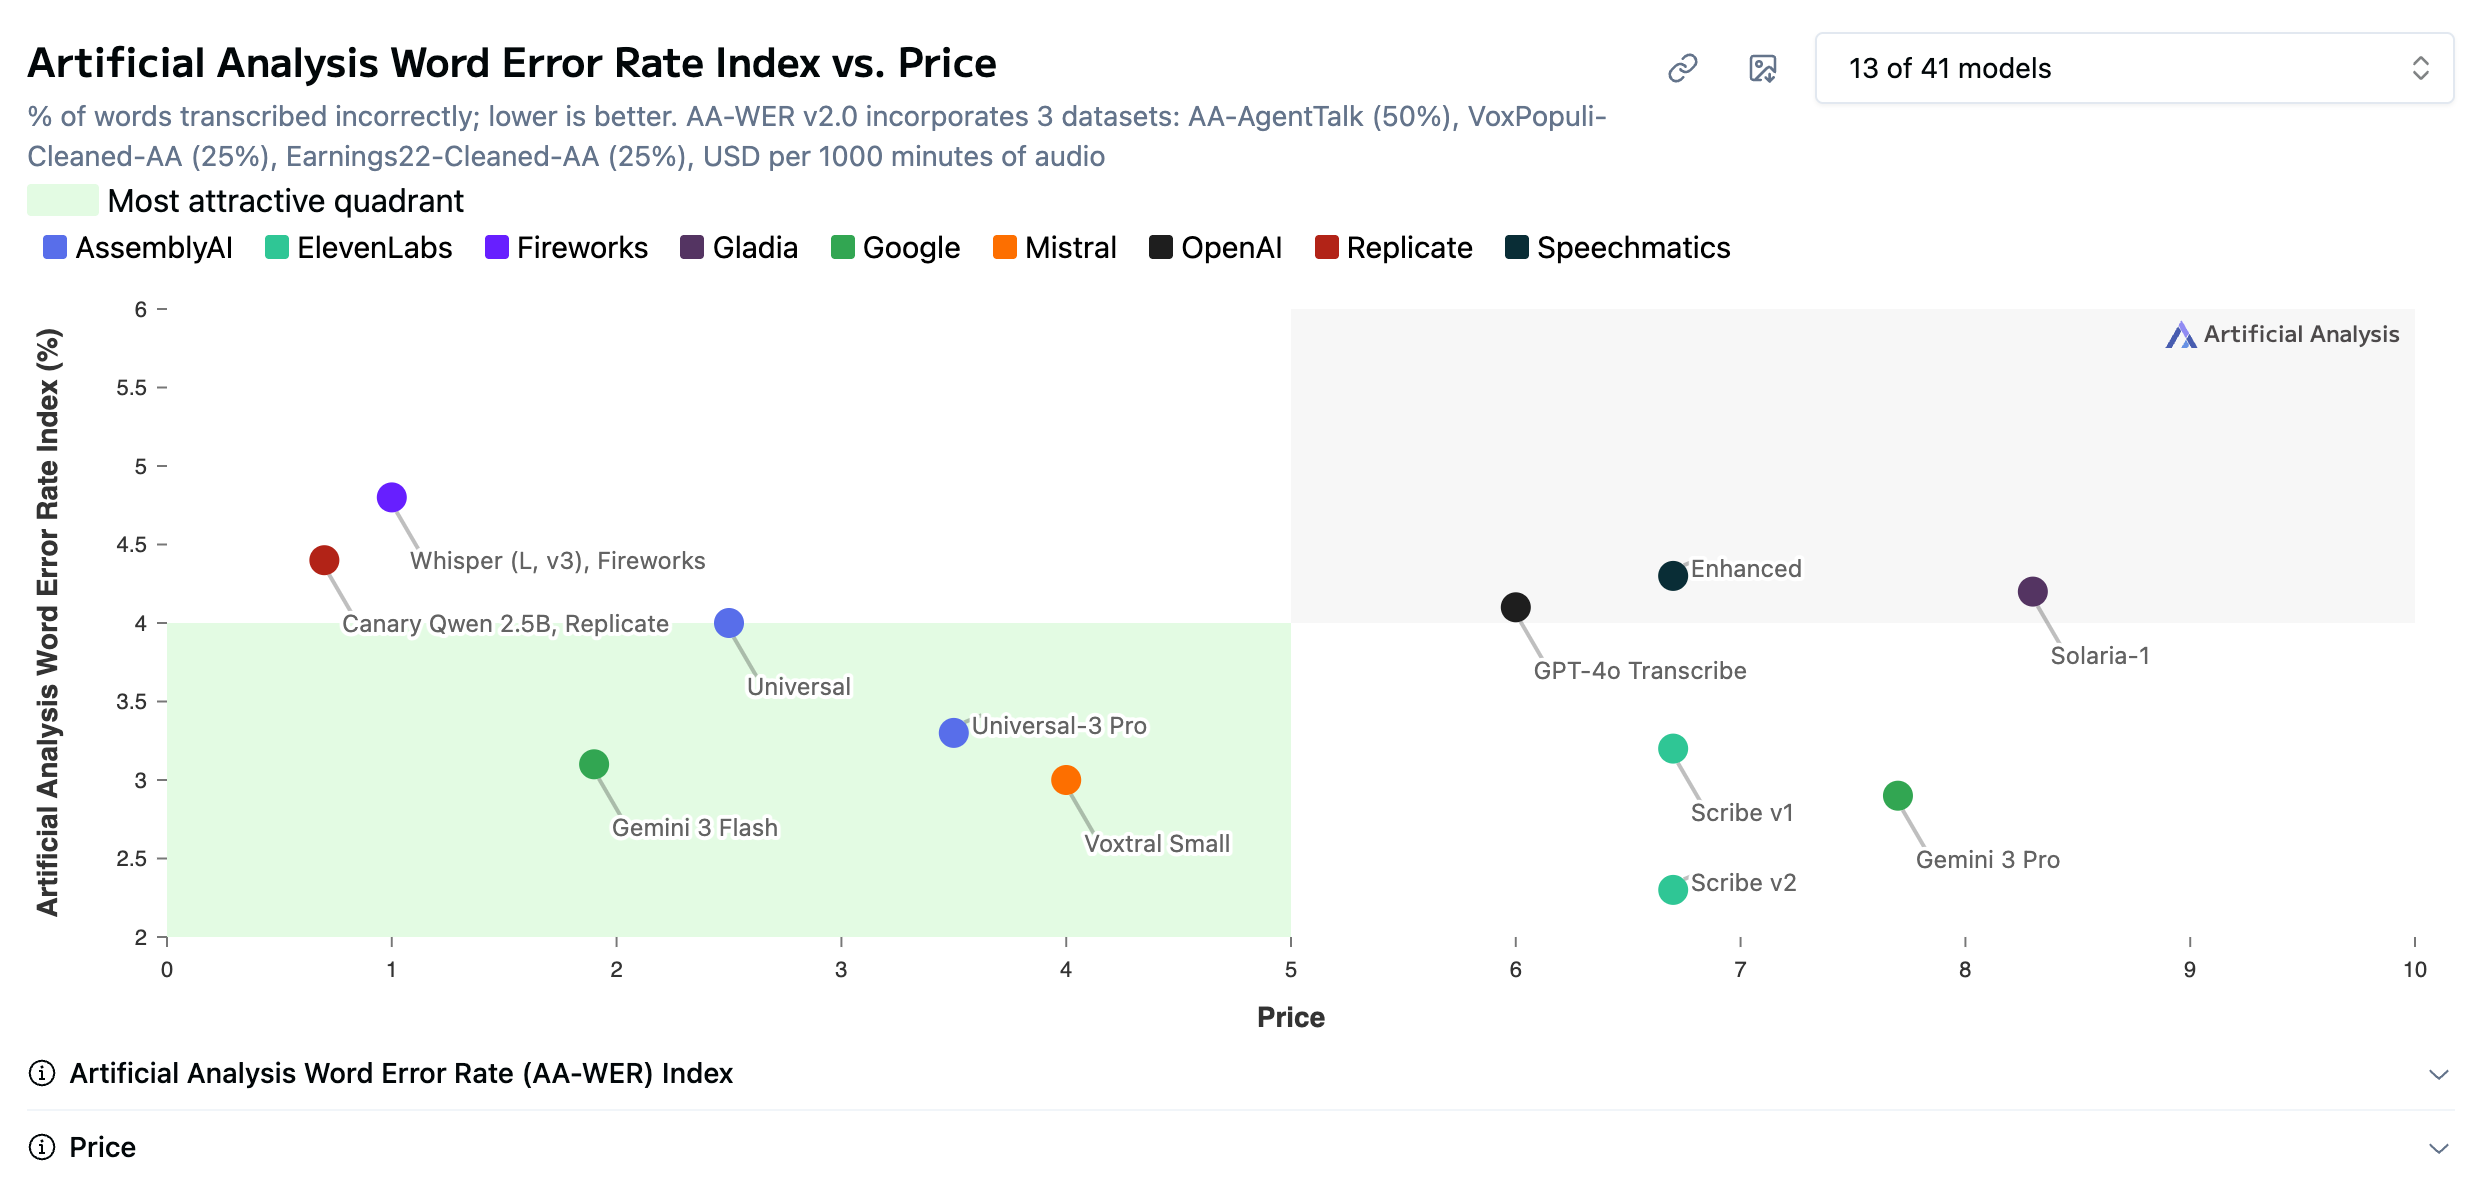
I’m going to remove these expensive models to declutter the models that are more reasonably priced.
I’m also going to drop a screenshot of Open ASR’s top models so I can talk about both leaderboards at one time.
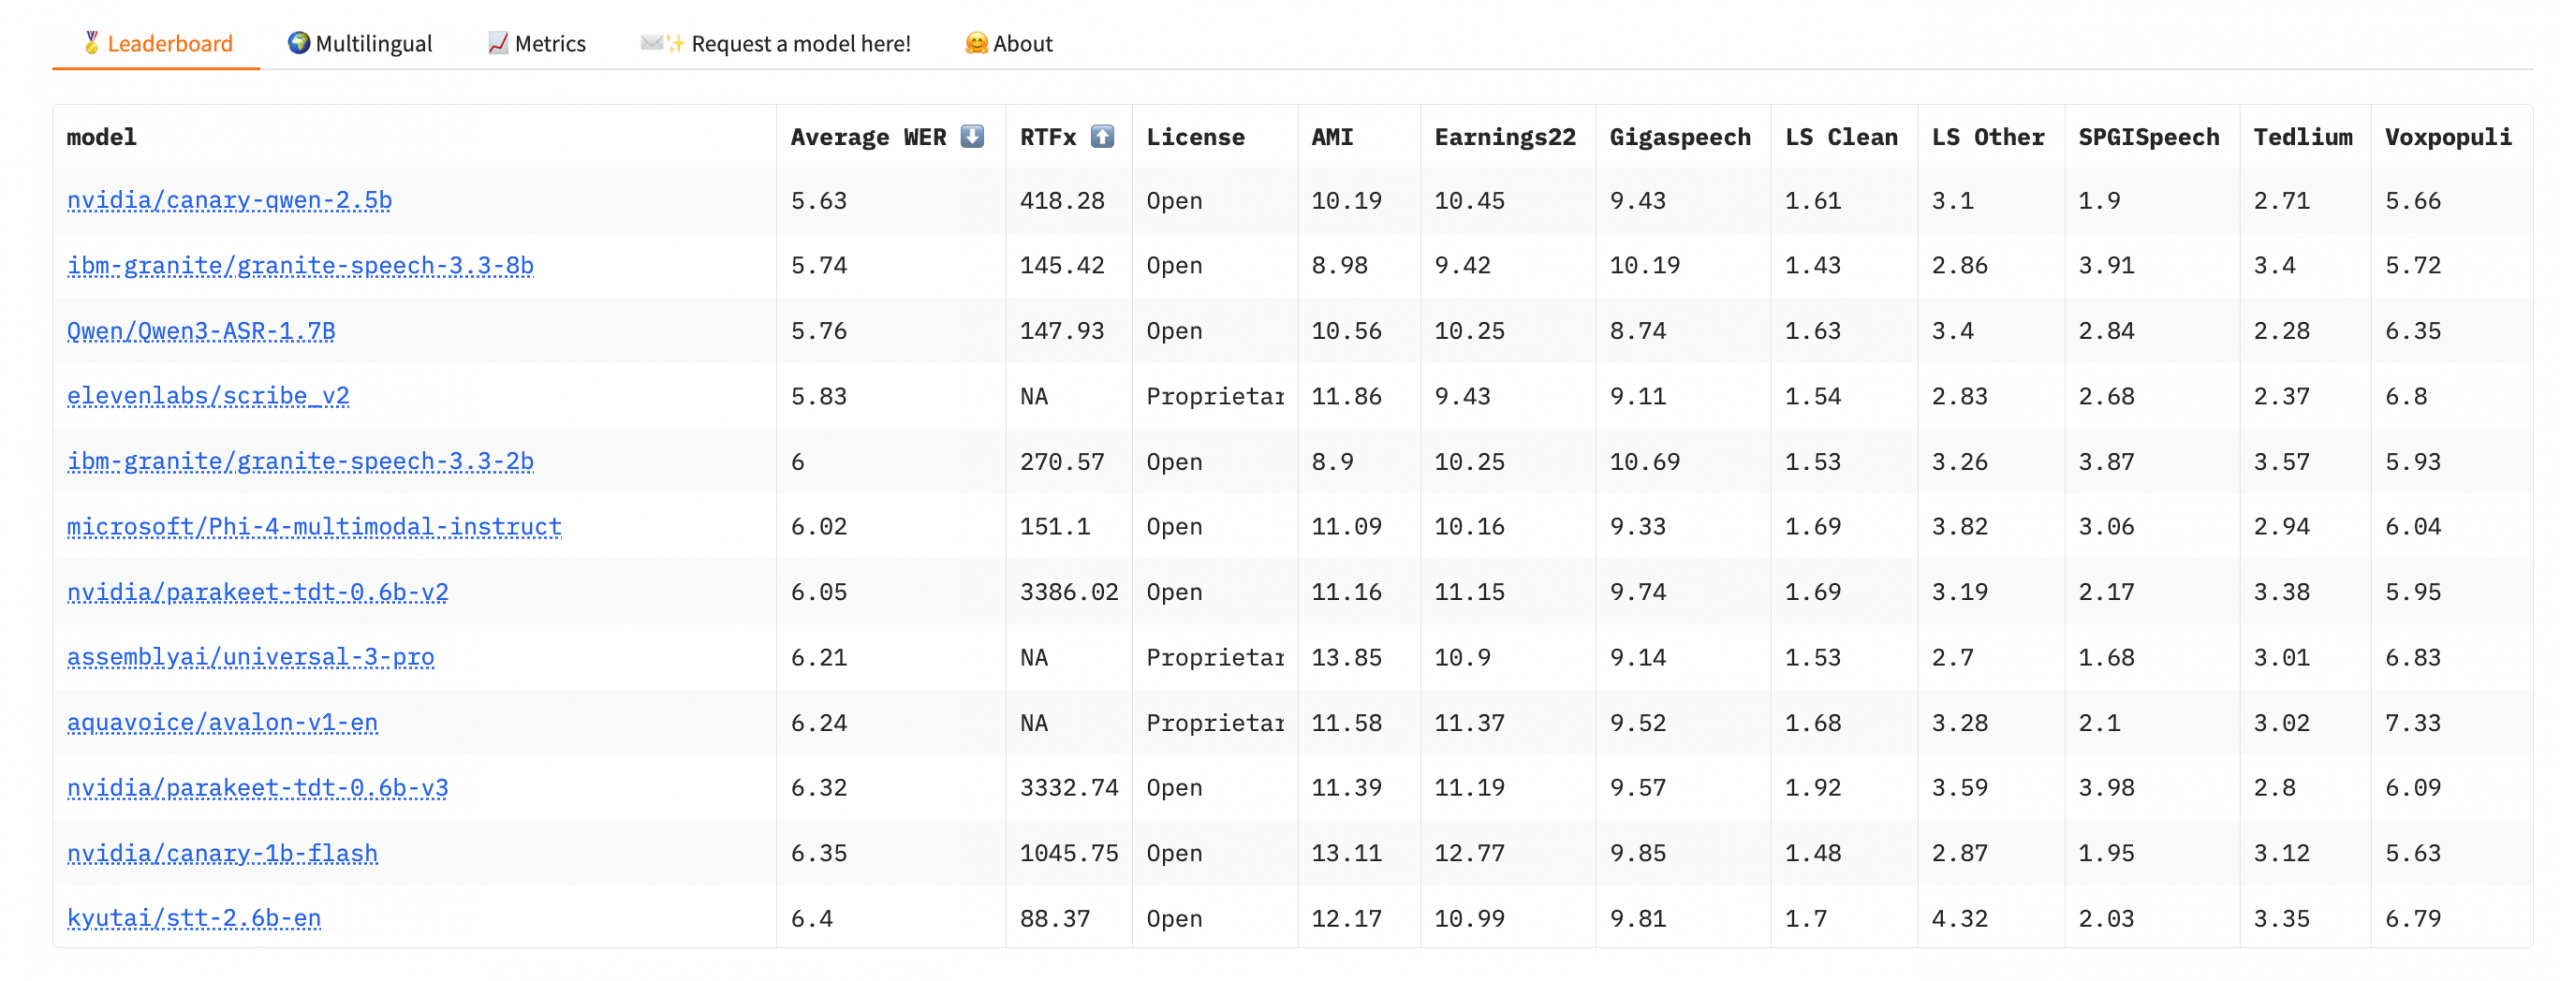
What I like about the Open ASR leaderboard is that it only includes open models. It’s hosted on Hugging Face, which makes sense as it is the leading promoter of open models.
What I did was peruse the top models in the leaderboard to make sure they were included in the sexier AA scatterplot. Because these benchmarks use different tests, you get a more comprehensive analysis of a model’s capabilities by comparing them. As was the case last month when I did this analysis for my friend, Qwen’s Canary 2.5b model is its top performer.
It’s important to note here that open != free per se. Open models still have inference costs because they require compute to run, which leaderboards estimate using cloud GPU pricing. That’s why AA includes the API provider in the model nodes because these benchmark values can vary wildly among API providers. You can usually find this table toward the bottom of any AA leaderboard.
However, for small projects or internal tools, developers can avoid most of that cost by running models locally on hardware such as a Mac mini using an inference framework. Frameworks like Ollama and LM Studio make this easy for text models, while speech models typically run through tools like Nvidia NeMo.
Step 3: Consider Other Relevant Benchmarks
Speed
There are scenarios where you would definitely want to consider other benchmarks in your analysis. If my friend had said he wanted to incorporate speech to text in a homework app for an EdTech company, my jumping-off point would have definitely included the speed benchmark. (Also latency but at the time of writing none of the leaderboards included in my app include latency for speech-to-text models.)
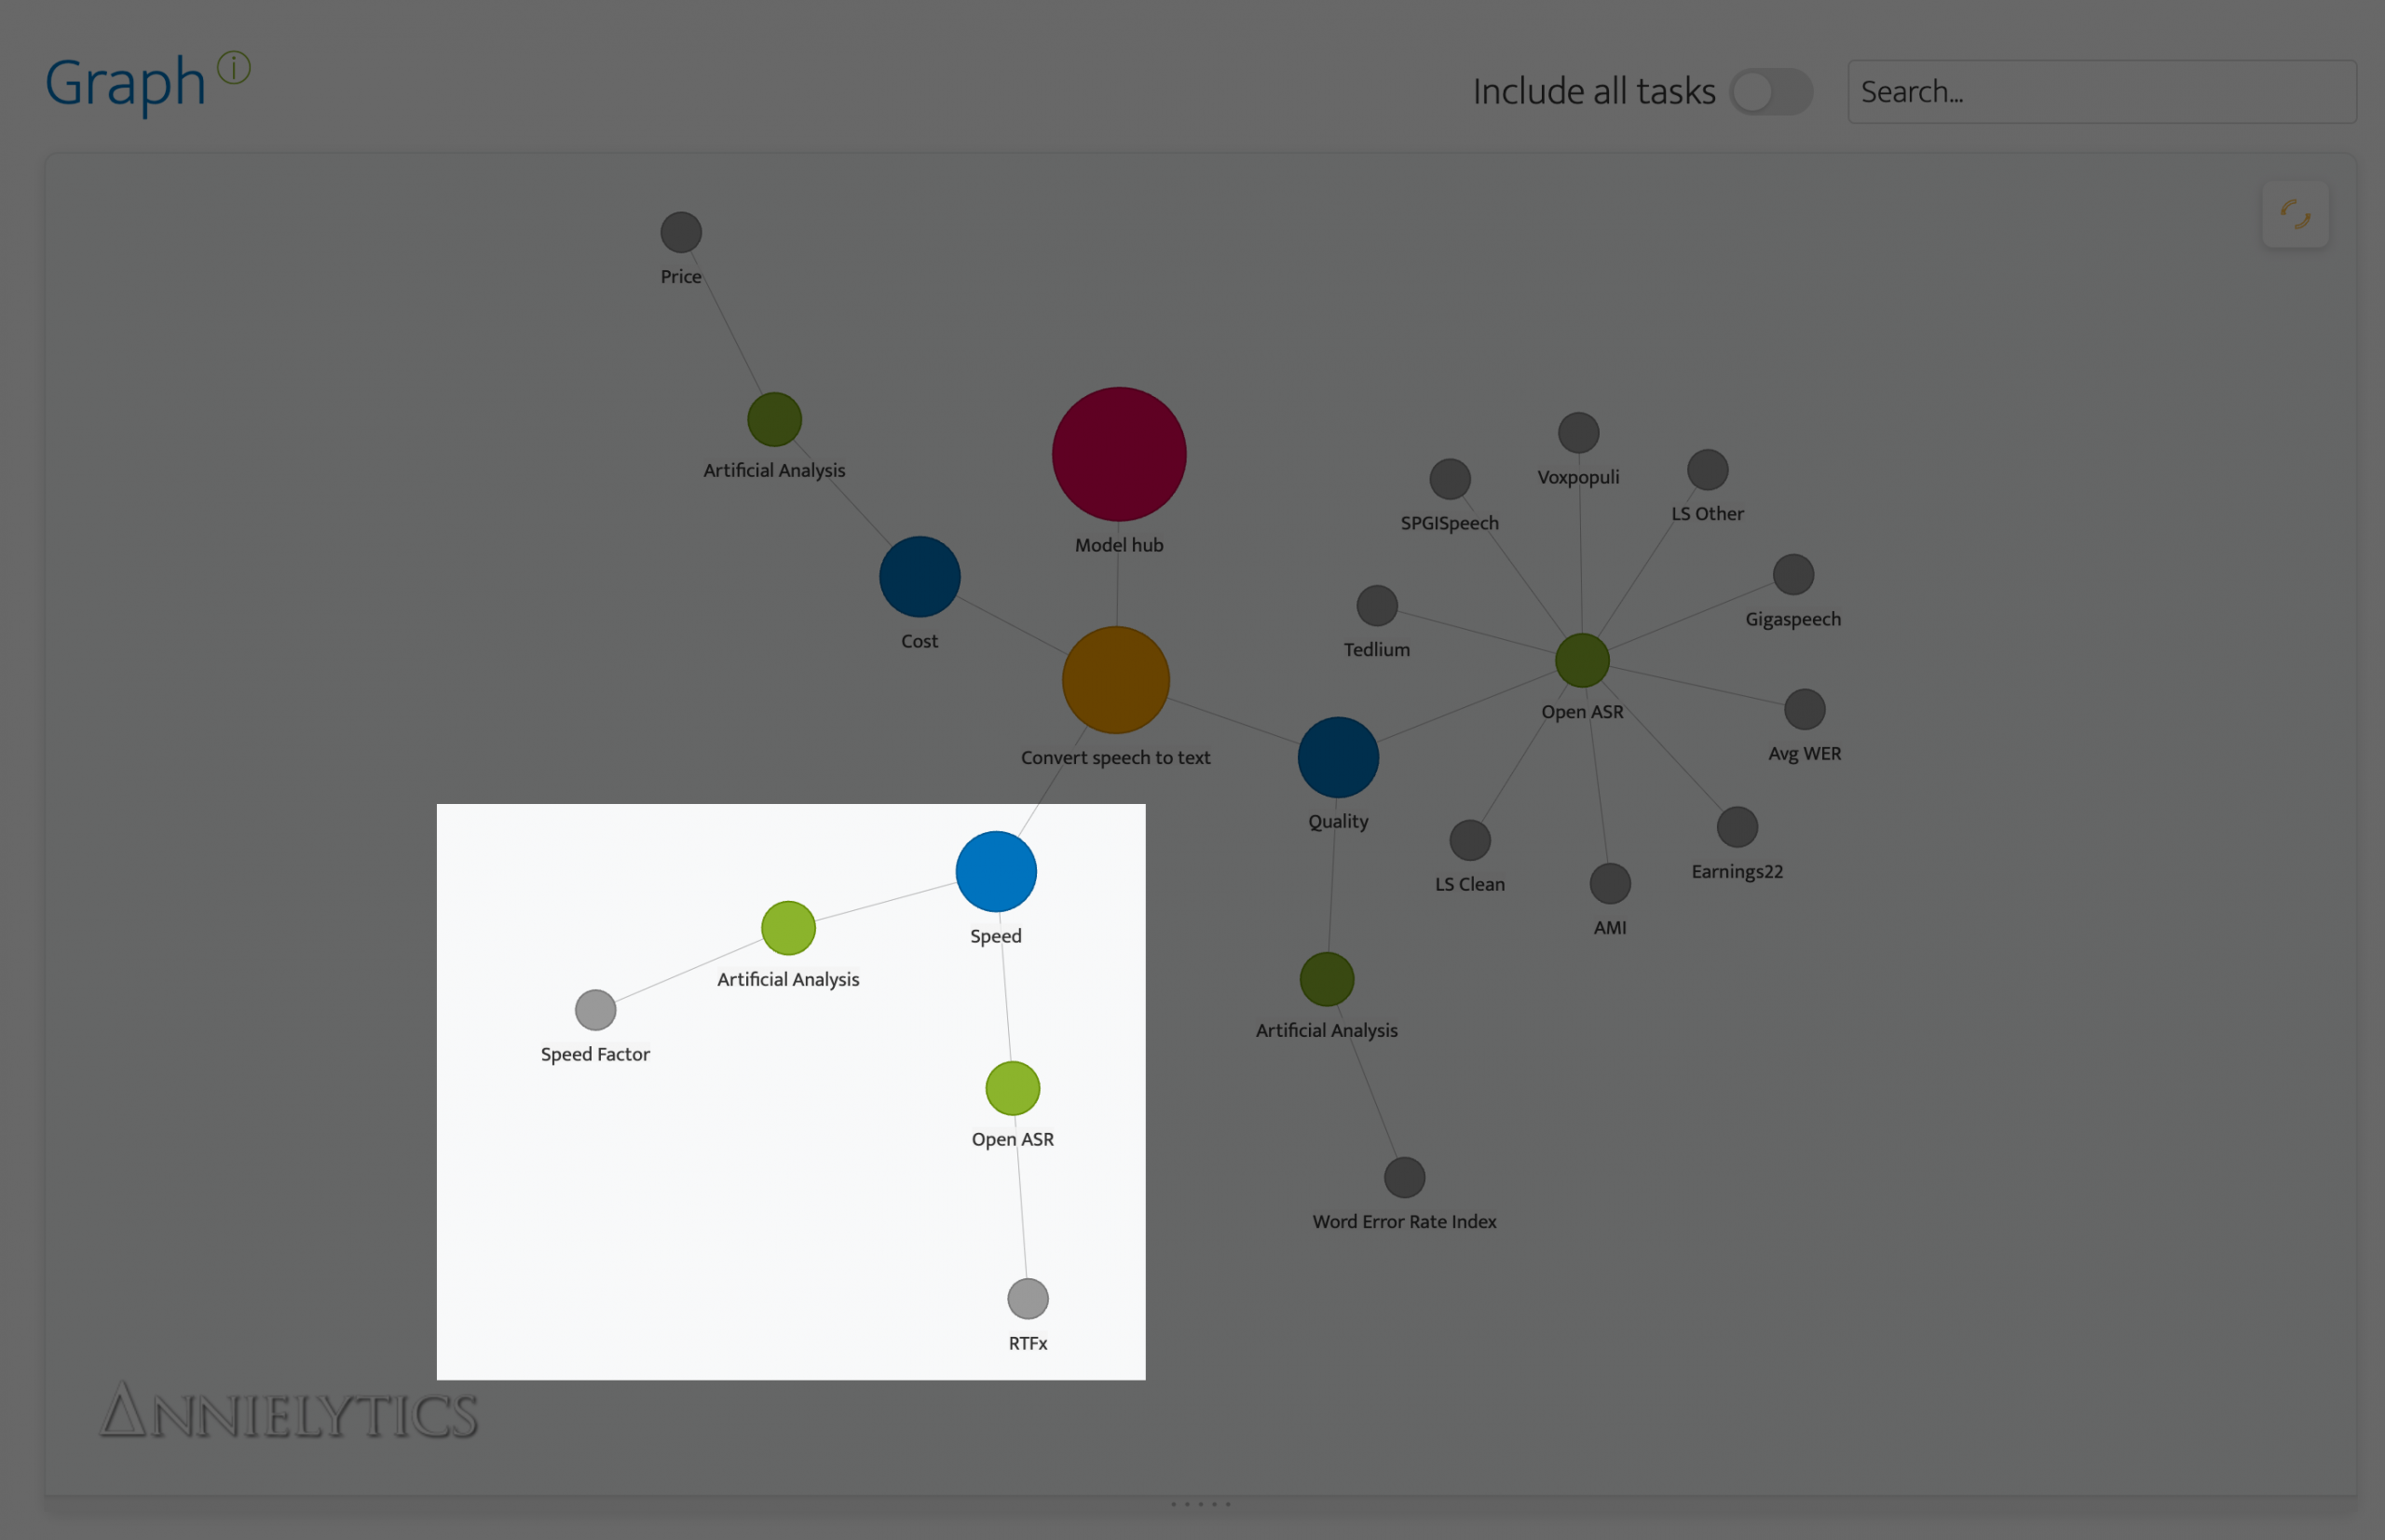
If you select the leaderboard nodes that extend from the Speed node, you will see benchmarks and tips that are specific to speed.
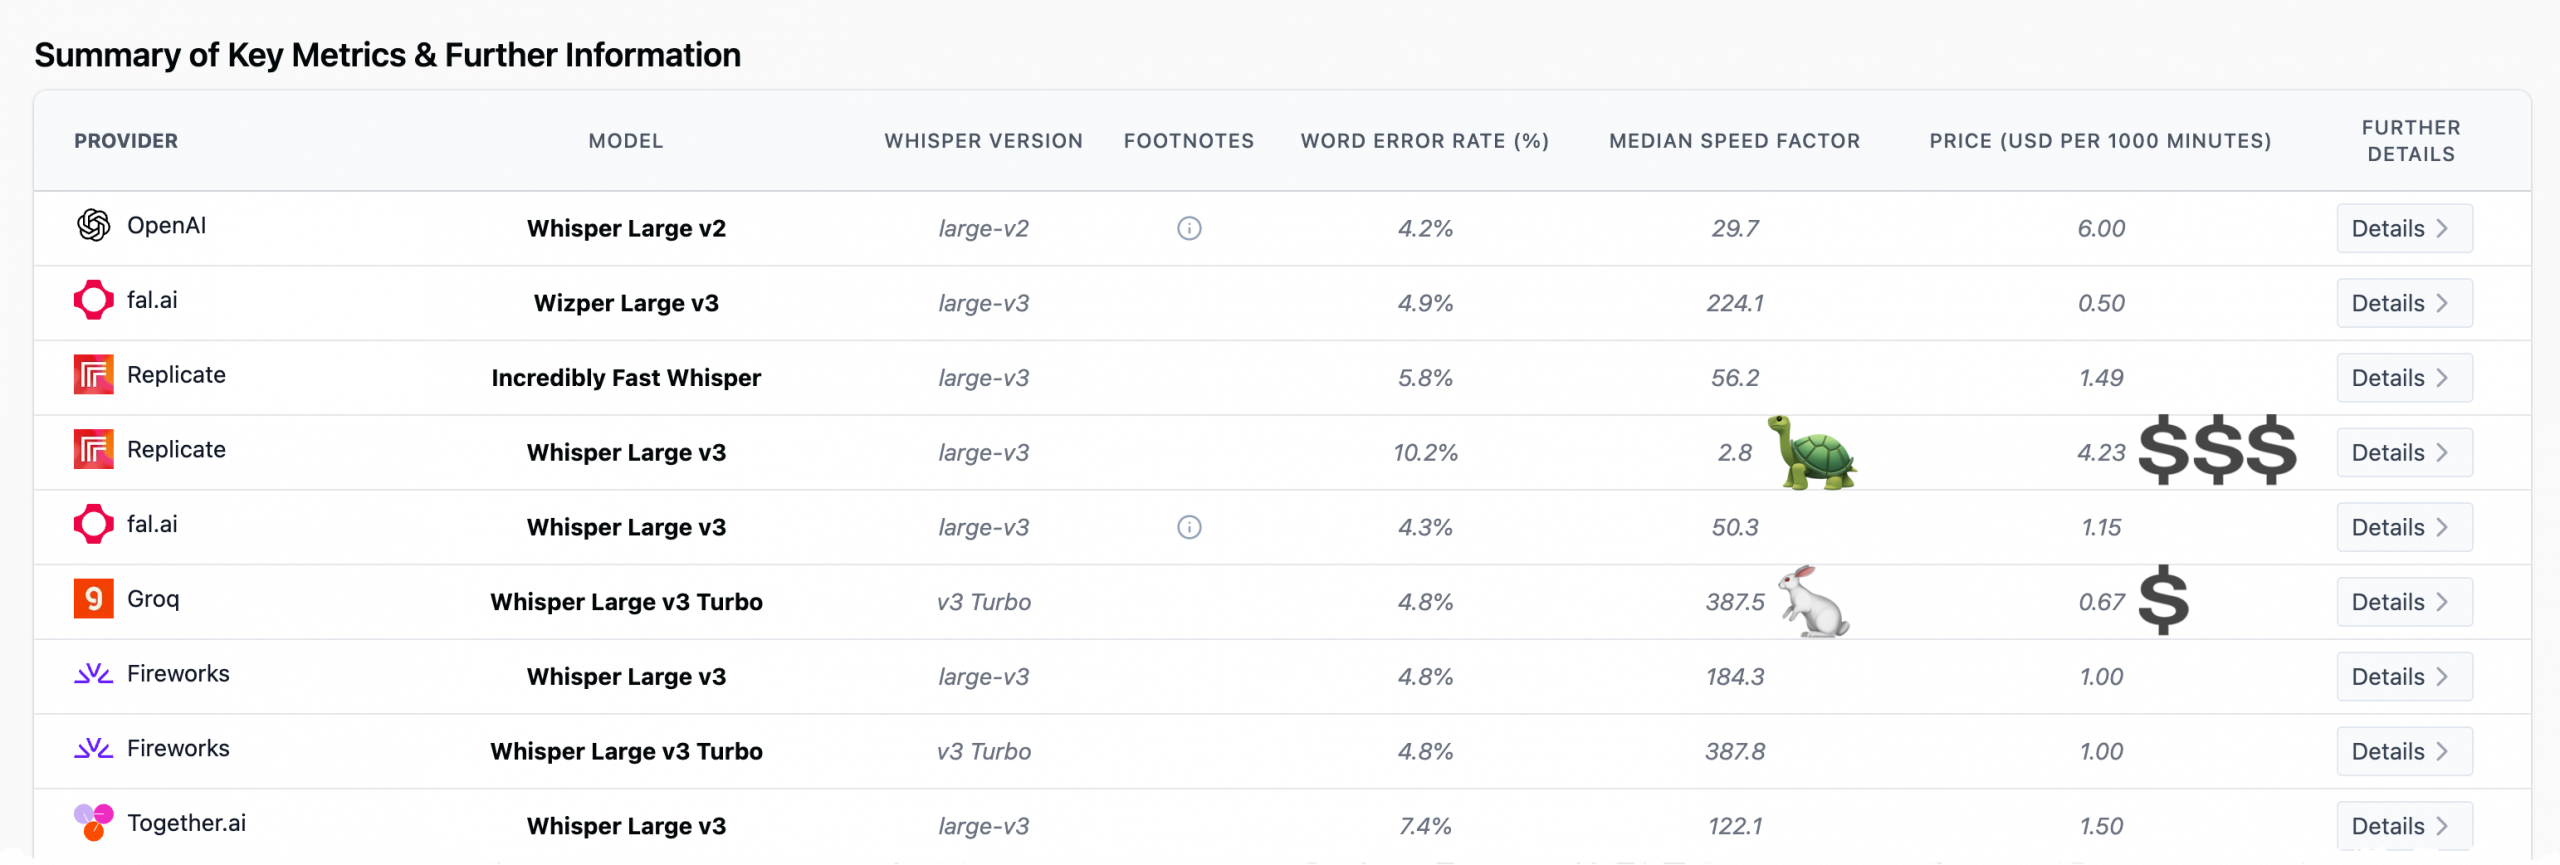
So if speed’s important but you still want an open model, OpenAI’s Whisper v3’s slightly higher WER might be worth its enhanced performance.
And it’s an open model, which you can verify by clicking on the Whisper v3’s node.
Multilingual Requirement
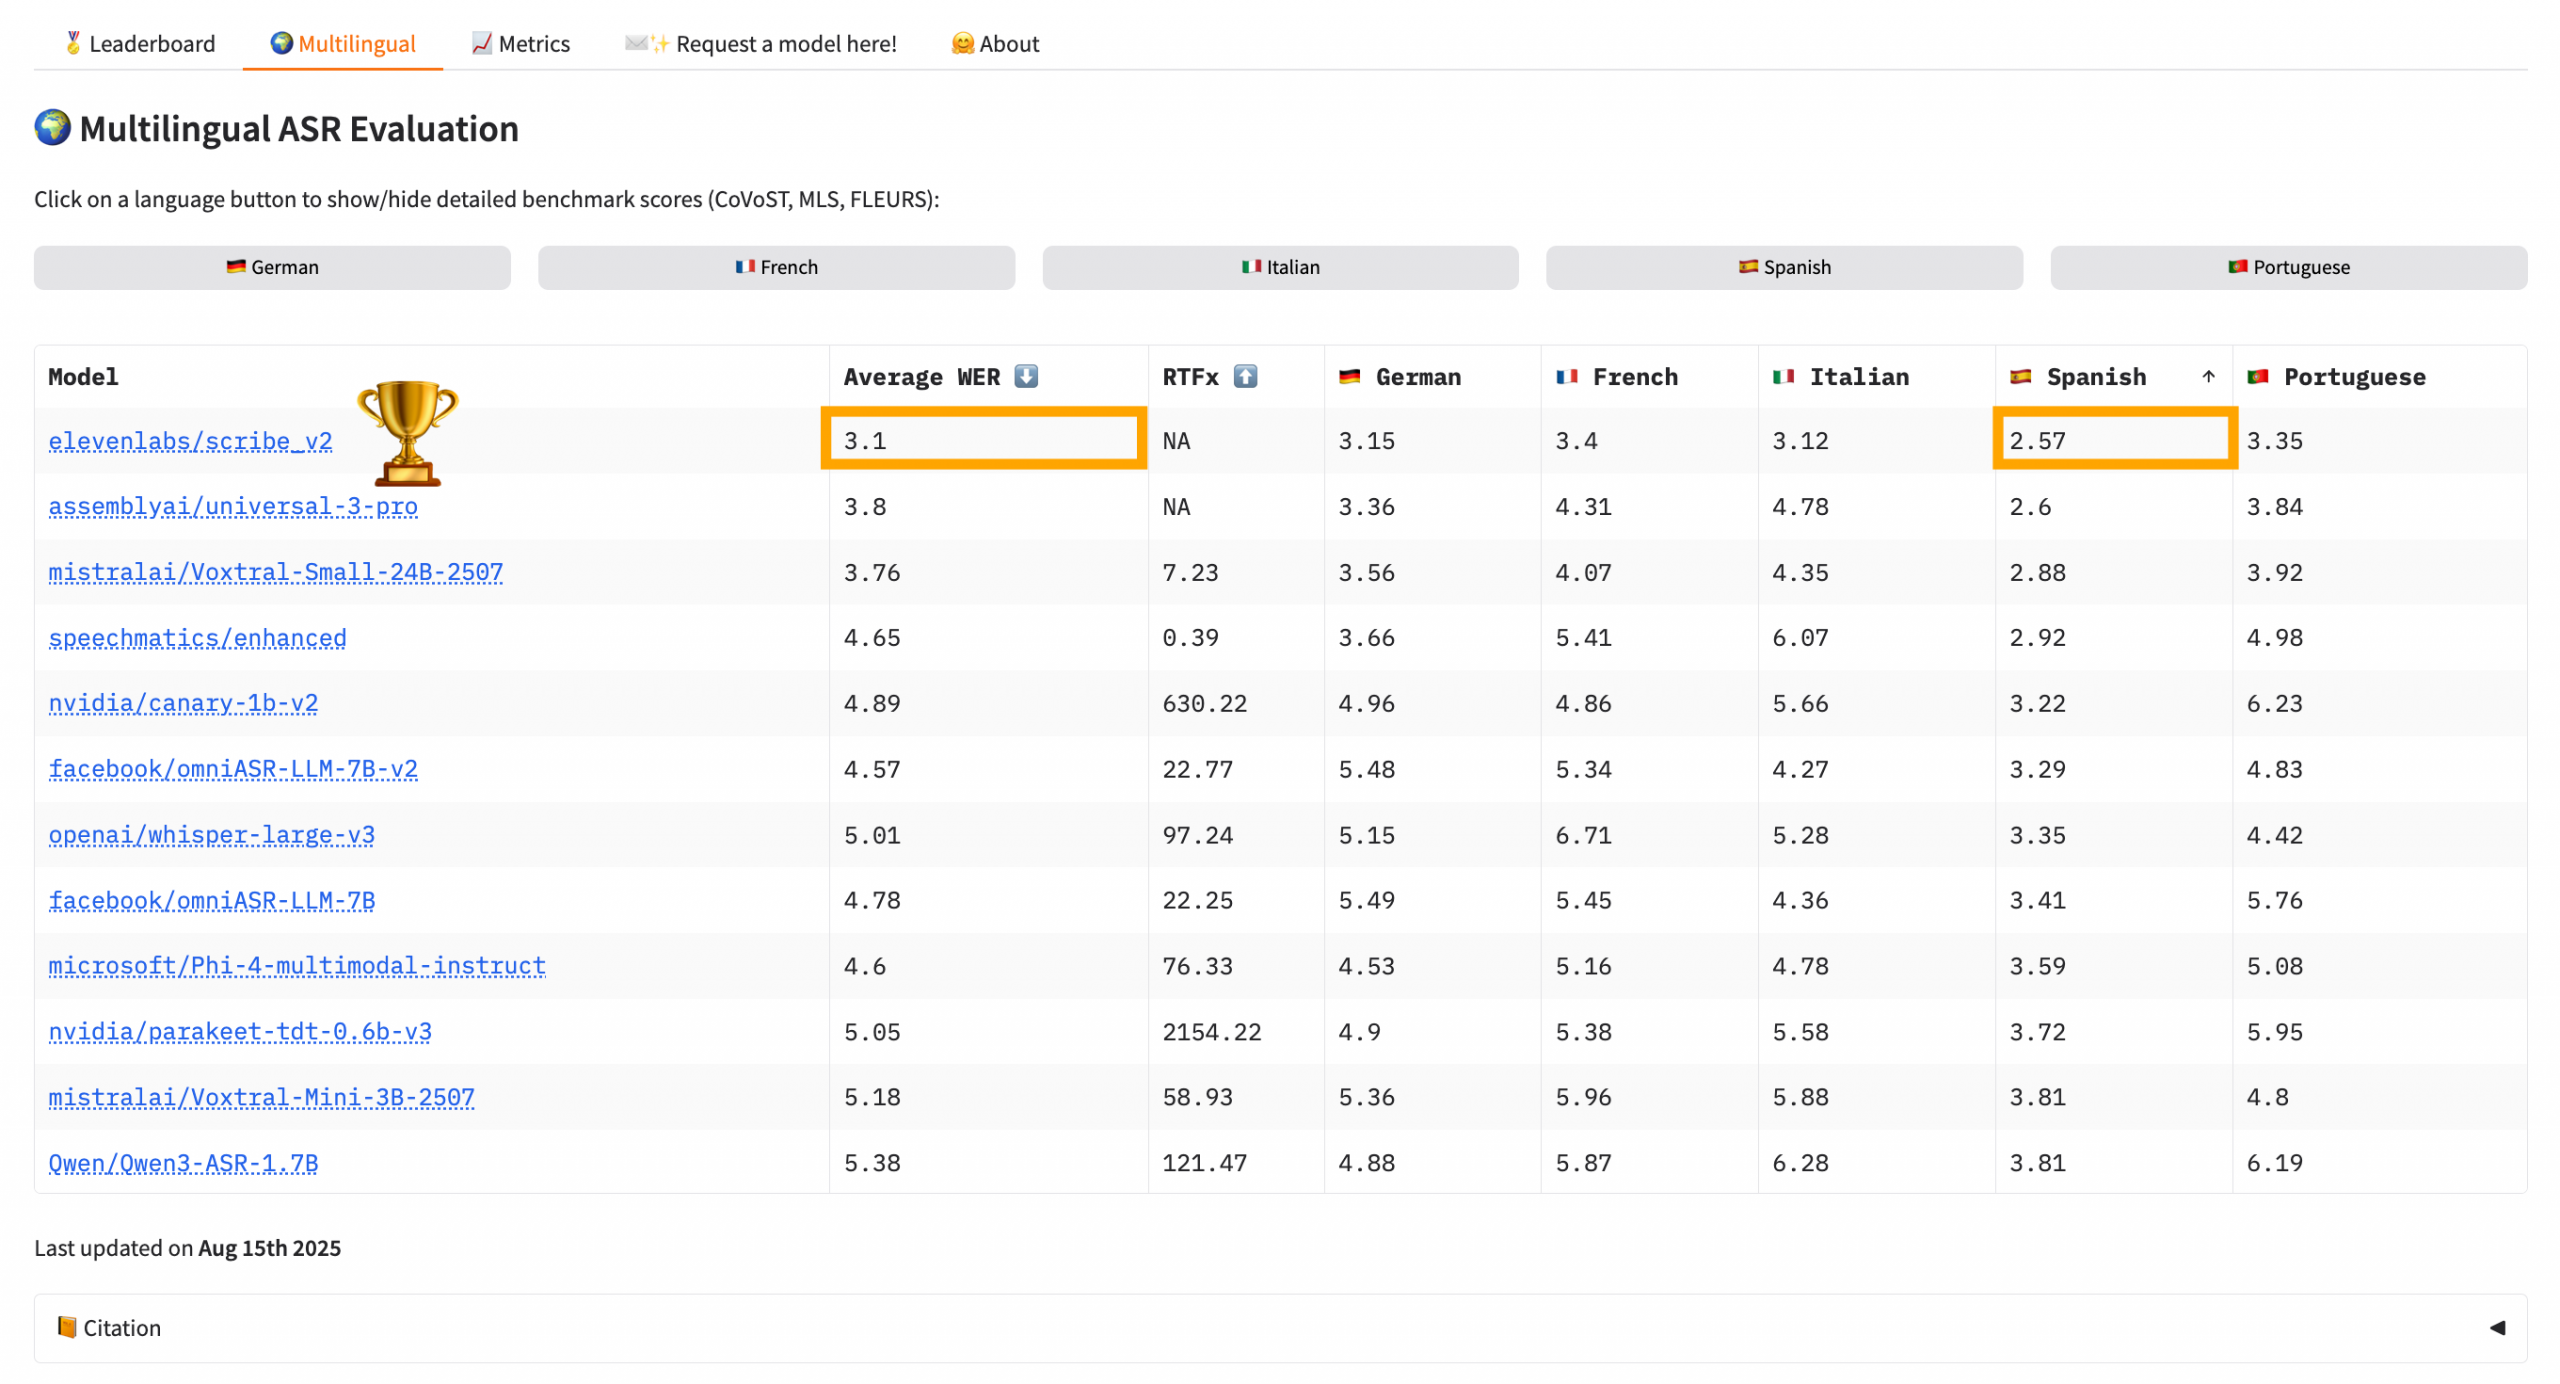
If you need your app/tool to be multilingual, Open ASR has a dedicated leaderboard for this purpose. And you can sort the table by language. So if I needed my app to capture English or Spanish, I’d sort the table by Spanish.
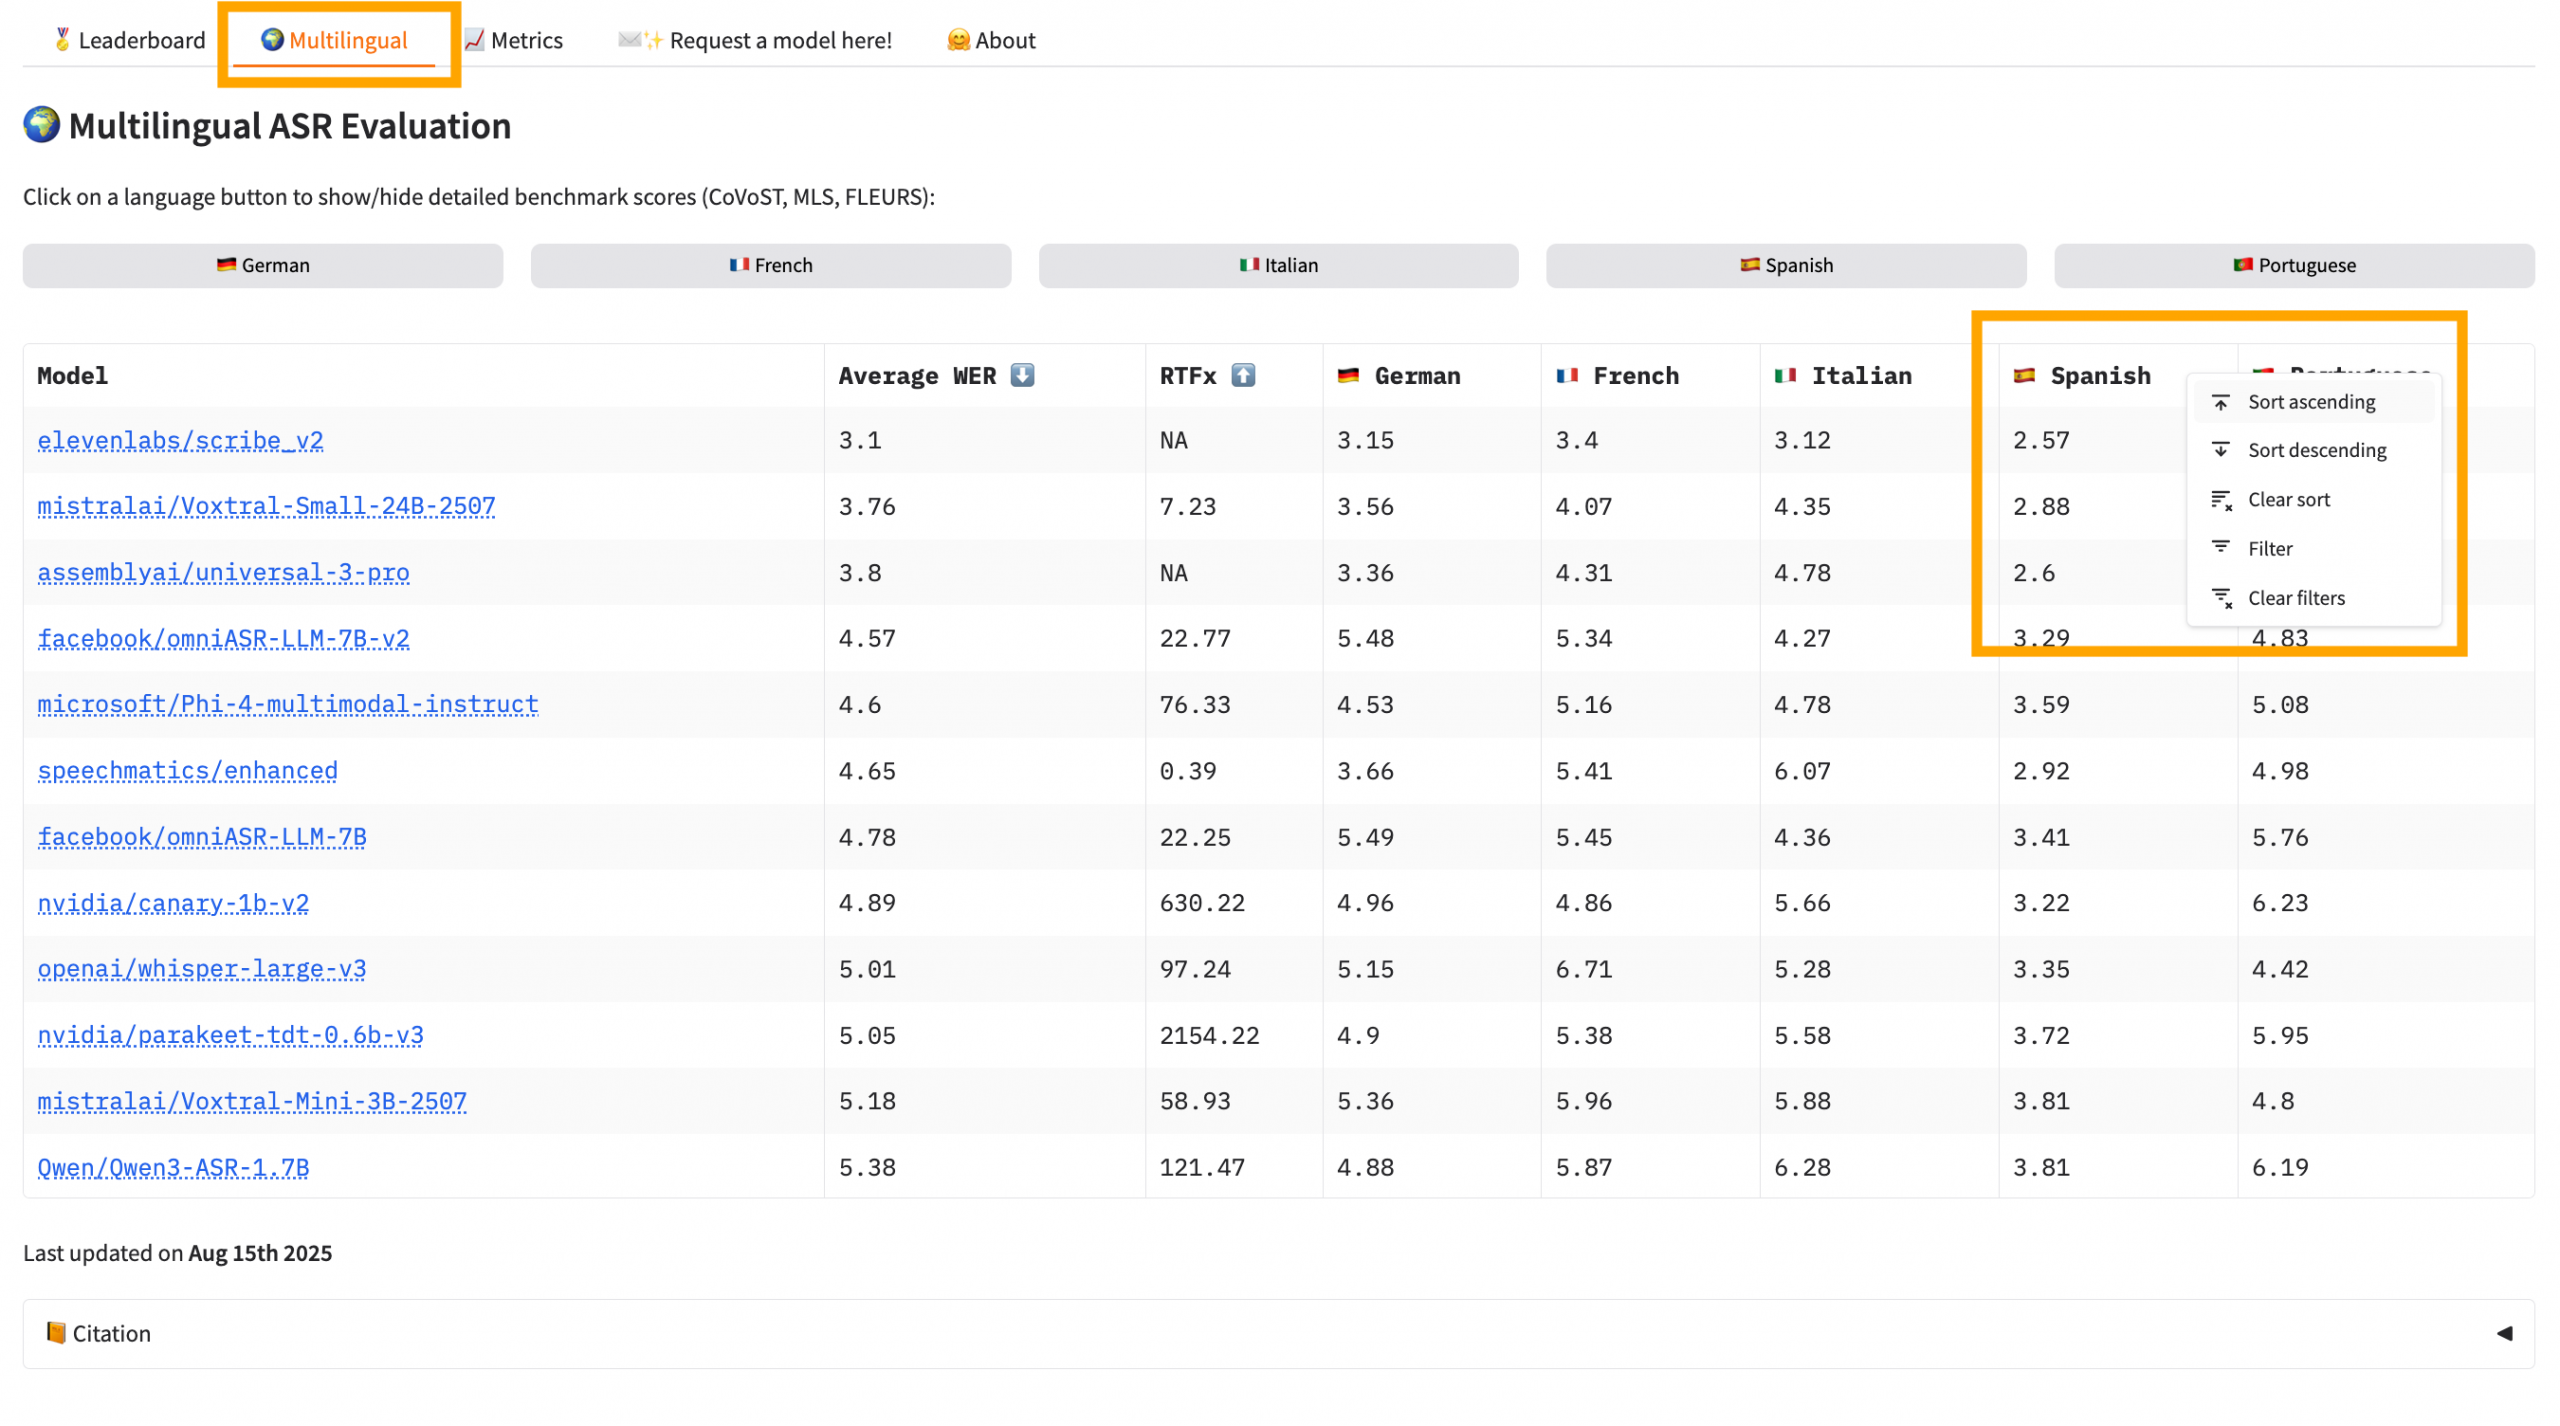
When I sorted by WER for Spanish, ElevenLabs’ Scribe v2 model floated to the top of the stack. It has a WER of 2.57 for Spanish transcription and an average WER of 3.1, which is impressive. AA put the cost between $6 and $7 per 1,000 minutes.
There are so many more rabbit holes just waiting for you in these leaderboards. I recommend scanning my tips column in the leaderboard nodes to learn about some of them. But even with as long as that column gets, there are always more.
Step 4: Confirm Deployment Options
Leaderboards tell you which models perform best, but before recommending one, you should confirm that it’s actually deployable for your use case. I checked that Canary Qwen was available as an open model, verified the hardware requirements (about 8GB VRAM), and confirmed there were working inference frameworks (e.g., Nvidia NeMo). This ensured the model wasn’t just a leaderboard winner but something my friend could realistically run.
I recommended he just indicate to Cursor that he wanted to use NeMo for inference and the free tier of Google Colab, which would provides access to a Tesla T4 GPU with 16GB of VRAM, more than enough brawn for his use case. Although my app du jour is Claude Code, all of these vibe-coding apps are excellent at building what you need. Just make sure you’re using version control and committing often because when they go south, they go for the equator.
This literally happened to me with an app I’m working on when I asked it to add a bomb emoji to the UI. Talk about your Easter egg from hell.
Step 5: Pick the Winning Model
My recommendation to my friend was the Canary Qwen 2.5B model because it performed consistently well across the leaderboards I compared while also being practical to deploy. On the Open ASR leaderboard it had the lowest word error rate (WER), and it also appeared near the top of Artificial Analysis’ quality rankings. That combination of strong accuracy and open availability made it stand out quickly. Because it’s an open model, it can be run locally instead of through a paid API, which means a small project like my friend’s homework app can avoid ongoing transcription costs while still benefiting from state-of-the-art speech recognition.
It really pays to learn to use these leaderboards. My app doesn’t include all of them, and I have a running queue of new tasks to add. As I mentioned earlier, there’s also no standard approach to them. I created this app because I needed data to back up my recommendations because clients had a powerful gravitational pull toward the frontier model companies, even though they are oftentimes overpriced and underperform because they can rest a bit on their laurels.
Leave a Reply