
Annielytics.com

I make data sexy

  • About
  • Resources
  • Services
  • Blog
  • Contact
  • Log In

Oct 03 2014

How To Create A Scrolling Table In Excel [VIDEO]

Scrolling table in Excel
Does this table ever end?

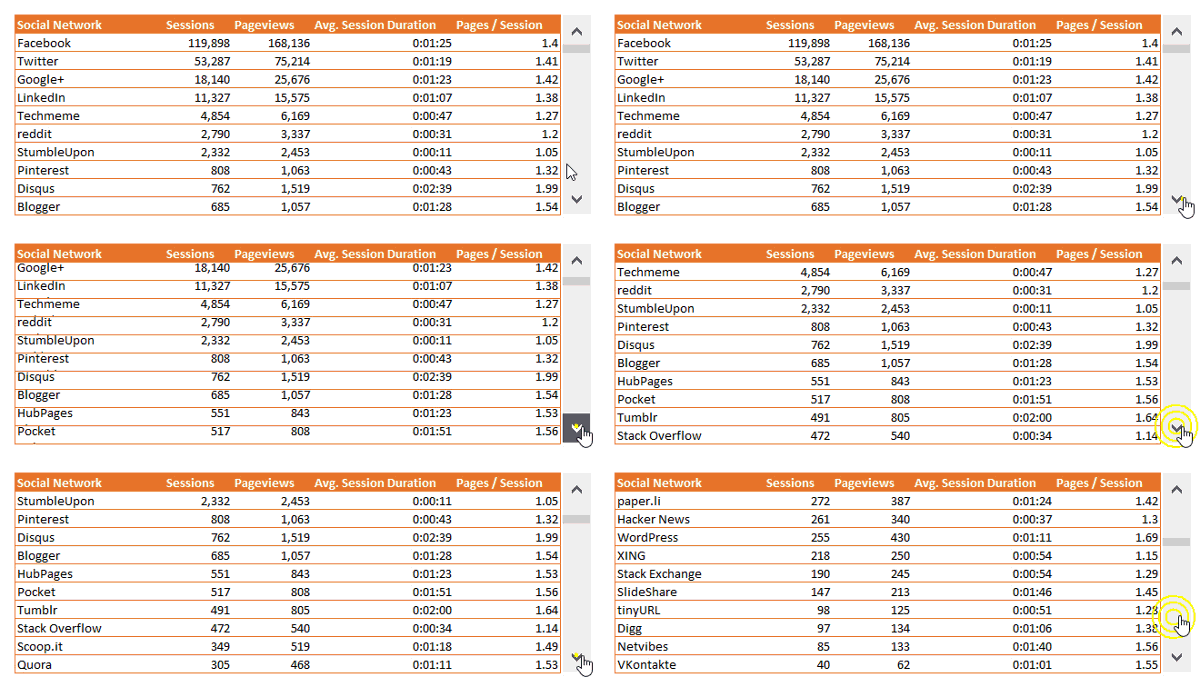
In today’s video I demonstrate how to create a scrolling table in Excel using the scrollbar option in your format controls. This is a great way to allow more data in a small space, such as a dashboard. You can see how this will look in the animated gif below:

Scrolling table from Google Analytics data in Excel

I use the INDEX function to add this interactivity. If you want to better understand the INDEX function, I did a comprehensive video covering three marketing uses for the INDEX function. (You’ll also find out why I always use the INDEX function over the OFFSET function.)

You can also see how I used a scrollbar to create a scrolling chart.

Video

Download File

If you’d like to download the file to follow along, you can get it here. (It’s a Dropbox link, so if your company blocks Dropbox, you may have to wait until you get home.)

Learn More

If you want to learn how to create compelling dashboards like this or this, check out my Annielytics Dashboard Course.
 

Written by Annie Cushing · Categorized: Excel · Tagged: Excel Dashboards, Excel Formulas, Google Analytics

Comments

  1. ranyere rodrigues says

    October 4, 2014 at 11:19 AM

    Nice one, Annie. Very useful.

    I love your videos, always with clear instructions and very informative.

    Reply
    • Annie Cushing says

      October 4, 2014 at 12:19 PM

      Thanks, Ranyere!

      Reply
  2. Kent Pawziuk says

    October 11, 2014 at 10:35 AM

    Very cool, Annie. Do you know if it’s possible to make a scrolling table from dynamic data? eg. if the reference table gets updated and gains or loses rows?

    Thanks!

    Reply
    • Annie Cushing says

      October 11, 2014 at 2:25 PM

      I’m sure you could with a macro. The only thing you can’t automate with a formula is the max value in the scrollbar. But you can automate anything with a macro. I’d use the macro recorder and attach the macro to a refresh icon that you can pilfer from Google Images. 🙂

      Reply
  3. Wouter Magre says

    February 23, 2016 at 10:29 AM

    This is a nice option for dashboards. I dit not have the need for it yet, but now I know it is possible,

    Reply
    • Annie Cushing says

      February 23, 2016 at 11:13 PM

      Perfect!

      Reply

Leave a Reply Cancel reply

Your email address will not be published. Required fields are marked *

CAN I HELP YOU FIND SOMETHING?

‘MAKING DATA SEXY’ IS LIVE ?

Want to learn how to create compelling, aesthetically pleasing charts in Excel? Learn how with Making Data Sexy.

Note: Also offered for Mac

STUFF I BLOG ABOUT

LEARN HOW TO USE ALL THE TOOLS

marketing strategy guide

DIY marketing strategy guide. This guide provides step-by-step instructions on how to perform 66 unique marketing tasks using 15 reputable marketing tools (both free and paid). Steal it for $295! Learn more.

LEARN TO DO A SITE AUDIT

site audit template

DIY site audit template. 20 sections, 215 checkpoints, 100+ explainer graphics, 218 pages, step-by-step instructions. Steal it for $295! Learn more.

LEARN TO DO AN ANALYTICS AUDIT

analytics audit template

DIY analytics audit template. 8 sections, 61 checkpoints, 100+ explainer graphics, 205 pages, step-by-step instructions. Steal it for $295! Learn more.

TO THIS DATA I DO THEE WED

dashboard course

Learn to build dynamic dashboards in Excel with Google Analytics data. 16 hours of video, 3 sample dashboards, 142-page workbook, practice Excel file, and more! Learn more.

FOLLOW ME ON TWITTER

SUBSCRIBE TO MY YOUTUBE CHANNEL

Privacy Policy
  • Email
  • LinkedIn
  • Twitter
  • YouTube

© 2021 annielytics.com