The Lite Membership really isn’t all that lite. You will receive quite a few benefits:
16+ Hours of Videos
Because we recorded a live seminar, these videos were designed to give you the feeling of actually attending the seminar. Except, you know, you can go to the bathroom whenever you want and attend in your pajamas. With a beer in hand. We supplemented the video with copious screencasts though so that you can see finer details than those who attended and were watching a screen in the front of a meeting room.
Below is a preview a video from Day 1.
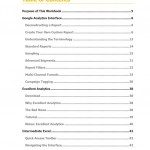
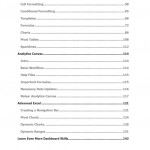
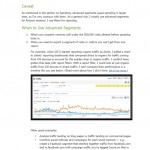
142-Page Workbook
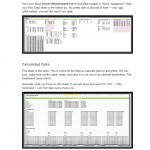
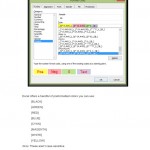
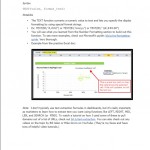
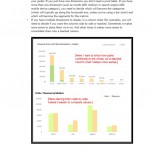
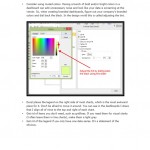
This workbook is pure gold. It’s chock full of screenshots, links, and valuable notes. You can also access a Bitly bundle with all of the links included in the workbook.
Below is a smattering of screenshots from the workbook.
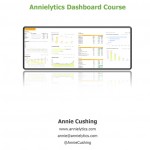
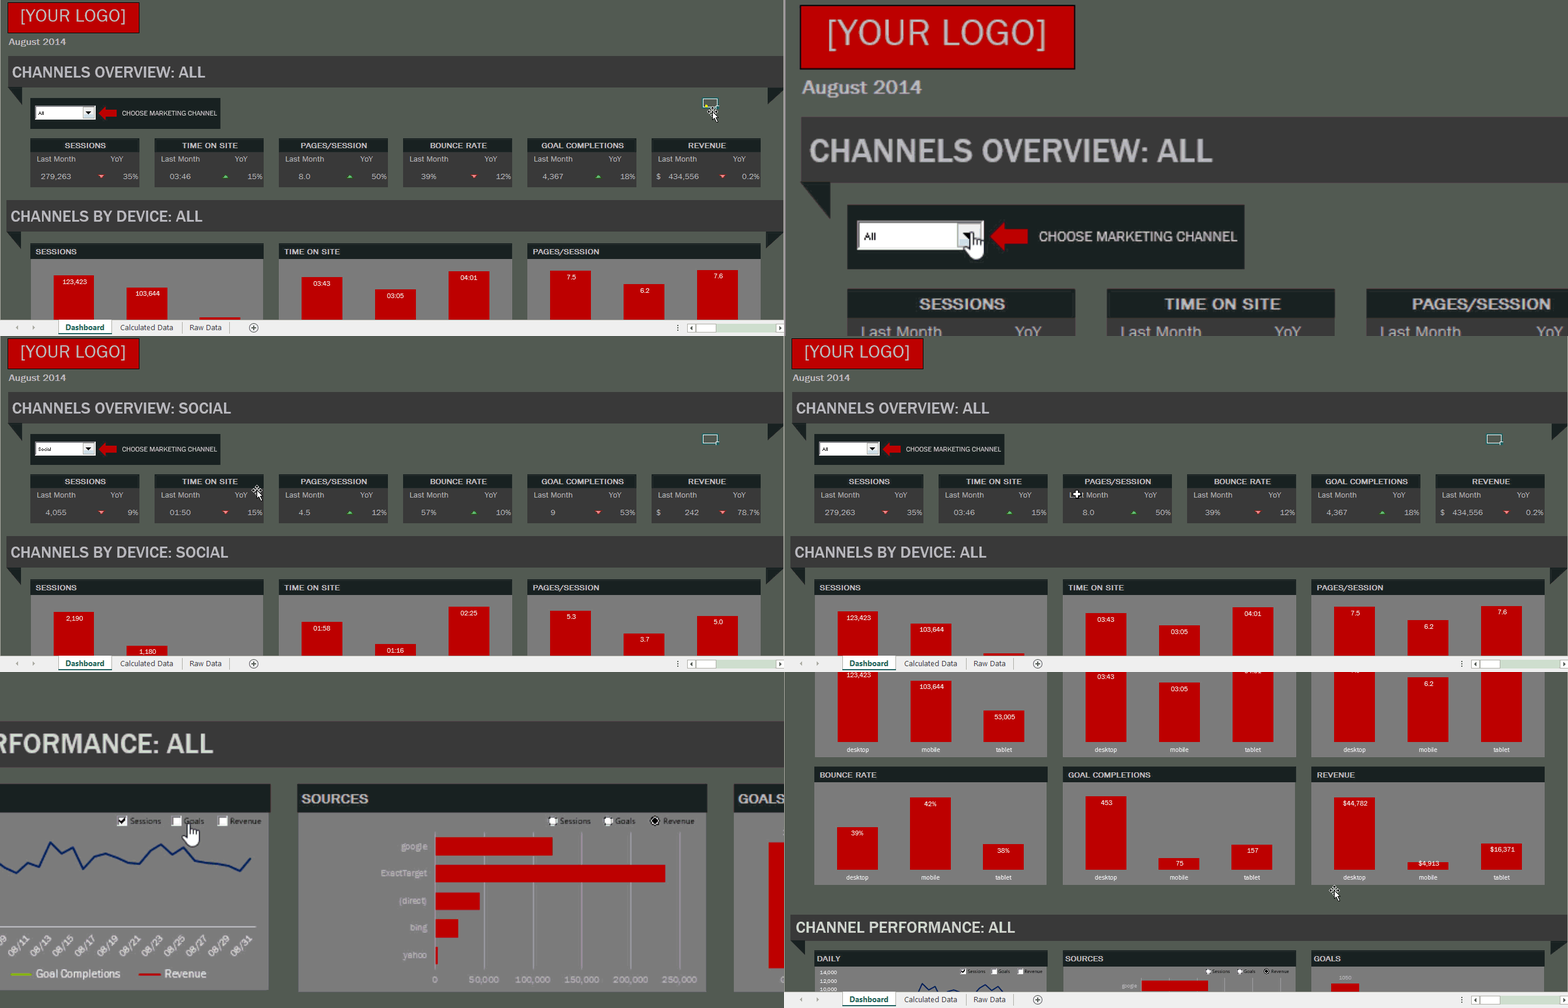
2 Excel Dashboards
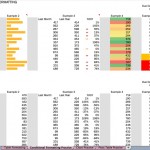
Excellent Analytics Dashboard
This dashboard uses the free Excel plugin Excellent Analytics. I go into a lot of detail in the course why this plugin isn’t good for businesses (because it hasn’t been updated in years and is missing access to the Multi-Channel Funnels). Because it uses pivot tables, there are things that need to be updated each month. But it has a macro that dynamically makes all the updates when you click on the update button.
Analytics Canvas Dashboard
Analytics Canvas is, hands down, my favorite Google Analytics API tool. And I believe I’ve tried all of them at this point. This dashboard uses AC and is completely automated because I show you how to pivot your data in Analytics Canvas, so you don’t need to use pivot tables in Excel (which have to be manually updated). You will learn in the course how to connect it with your own data, such as your goals, dimensions, views, etc. The entire dashboard updates with the click of a single button in Analytics Canvas, making reporting a breeze.
Analytics Canvas doesn’t offer an affiliate program. It would be more financially beneficial for me to promote other API tools. But, being a purist, it’s my favorite because I believe it’s the best. And, unlike Tableau, it stays on top of Google Analytics new features and many changes.
More Dashboards
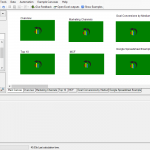
To provide more examples of the kind of power you can achieve with marketing dashboards, I created a couple additional examples for members:
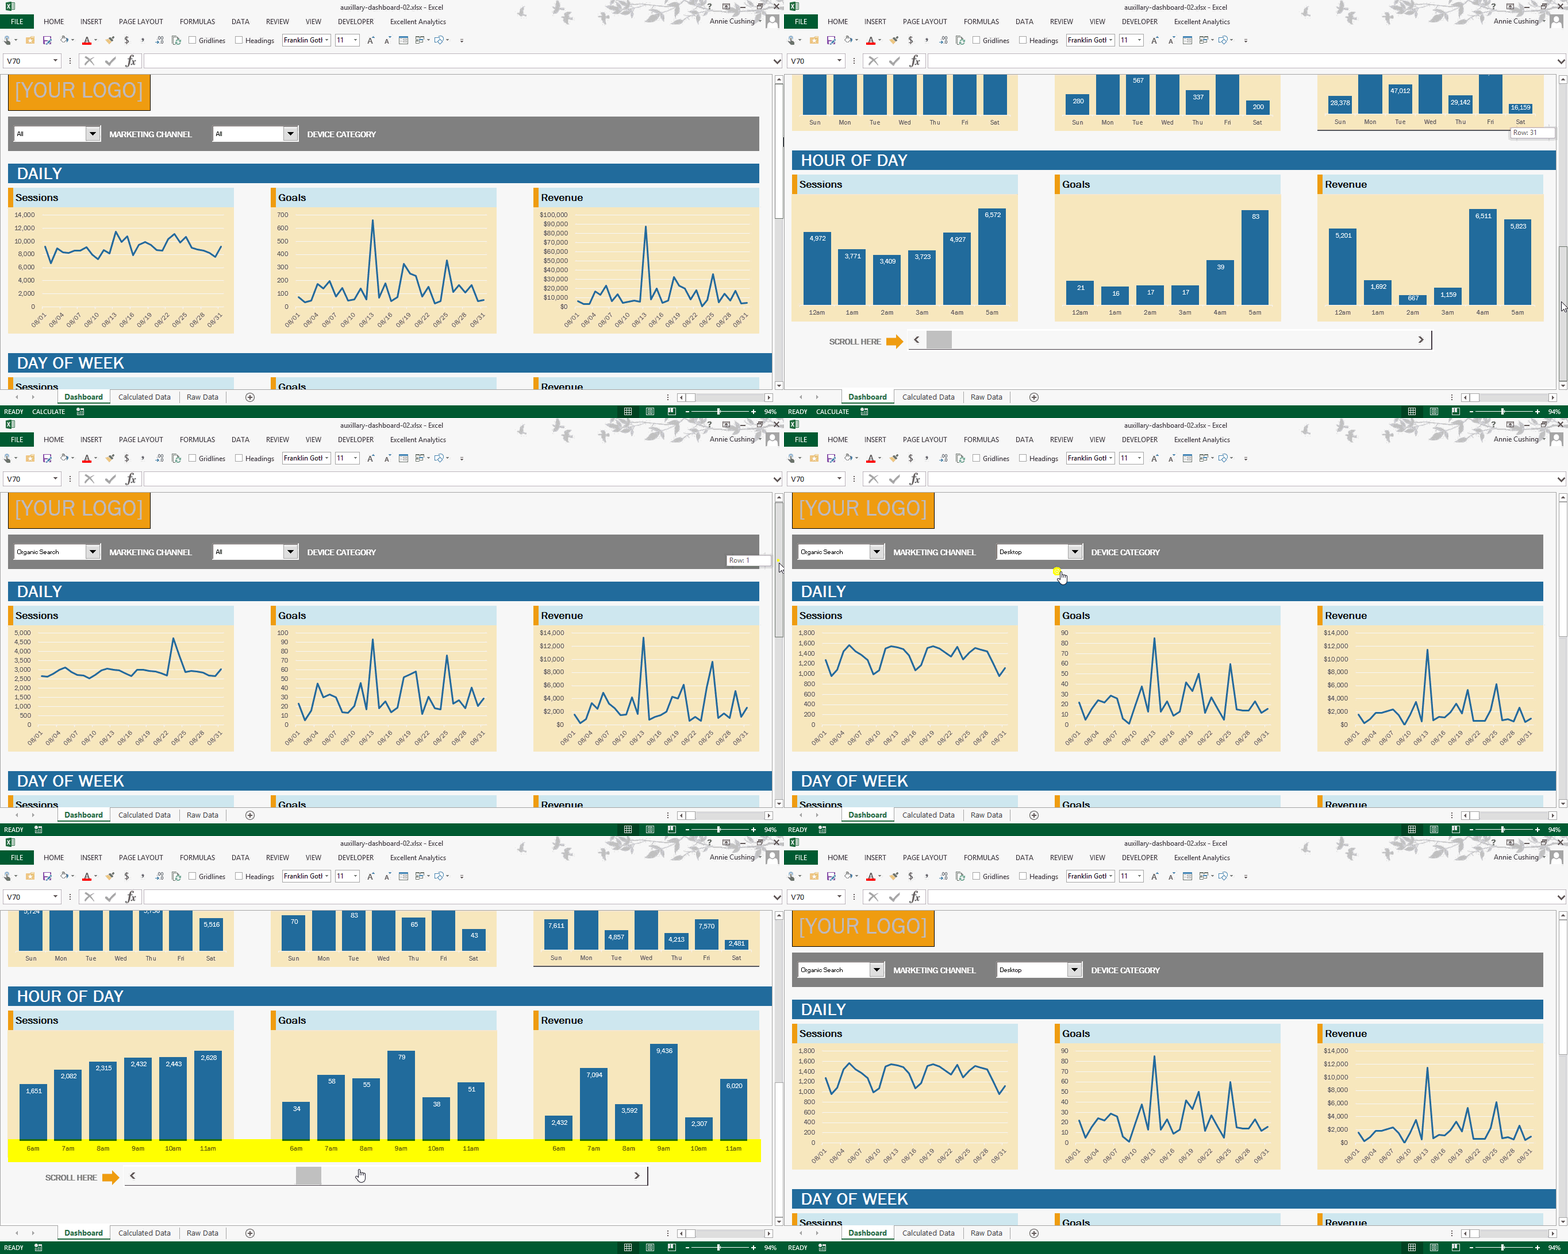
You will be able to download these files and apply them to your Google Analytics account.
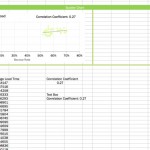
Charting Practice File
Day 2 is all data visualization, and I go through a practice file I created for attendees to follow along with. You’ll see finished visualizations and will be recreating them as you follow along.
There are four tabs:
- Table Formatting Practice
- Conditional Formatting Practice
- Chart Practice
- Pivot Table Practice
Analytics Canvas Template
Analytics Canvas allows you to bring Google Analytics API data right into Excel. It has a UI that’s easy to work with. But, for analytics aficionados, it provides a lot of advanced functionalities, such as renaming mistagged campaigns, pivoting, applying Excel-esque formulas to your data, grouping that the Google Analytics interface doesn’t allow, joining Google Analytics data with data from other sources (Google Spreadsheets, Excel files, other databases, etc.), and much more.
The template I created many demonstrates many advanced techniques that you can look at and learn from. For example, I recreate the new(ish) and super-awesome Channels report. This isn’t currently possible to do in the interface or the API. I was able to reverse engineer the Channels report so that you can do things like separate out social referral traffic from non-social referral traffic. (Google Analytics should give us this ability in all reports!)
Updating the template is made easier by the annotations I included throughout that let you know what elements need to be updated or modified to match your needs.
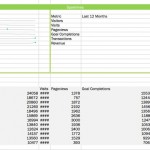
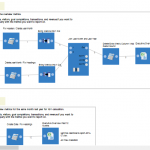
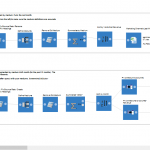
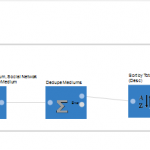
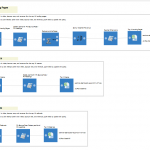
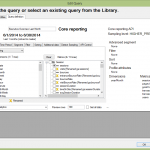
Below are a handful of screenshots from Analytics Canvas.
Terms of Service
Please look over the Terms of Service to read all the scintillating fine print. At least check out the pic of my attorney after writing up this exhausting piece of legalese! 🙂

