TL;DR: You can buy either the Google Analytics or Excel mini course for $95. Each has 6+ hours of video and auxiliary files.
Google Analytics Mini Course
There are a few words to describe this mini course:
Comprehensive
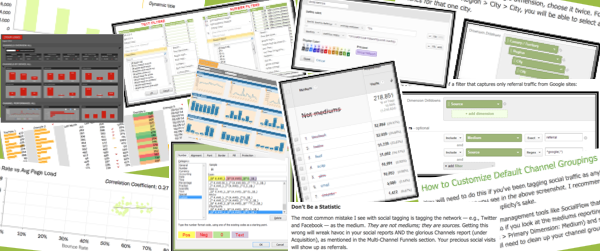
The Google Analytics Mini Course is a pivot on the Annielytics Dashboard Course, which is a full, comprehensive course on how to create dynamic dashboards that connect with Google Analytics in Excel. The Google Analytics Mini Course covers day 1 of the three-day course I originally did in person. It includes 28 instructional videos, totaling 6+ hours of instruction and is the perfect solution if you’re just looking to learn more about Google Analytics but don’t need to build out dynamic dashboards at this time.
Here’s a list of the video titles:
| Course Introduction | 25:05 |
| Custom Reports & Pivot Tables | 16:31 |
| Custom Reports & Regex | 14:18 |
| Google Analytics Interface & Channel Report | 14:32 |
| Audience Overview Report | 17:10 |
| Data Row Number Hack | 7:51 |
| Google Analytics Terminology | 14:04 |
| Google Analytics Filters & Admin Area | 14:45 |
| Deduping Content Reports | 8:46 |
| Site Search Reports | 10:15 |
| Google Analytics Dashboards | 13:45 |
| Real-Time & Audience Reports | 4:36 |
| Behavior Reports | 7:40 |
| Google Analytics API | 13:11 |
| Custom Variables & Device Category | 14:02 |
| Custom Variable Scope | 10:49 |
| Acquisition Reports & Campaign Tagging | 14:47 |
| How to Handle “Not Provided” Data | 14:36 |
| Linking AdWords to Google Analytics | 13:03 |
| Behavior Reports | 12:48 |
| Site Content & Site Speed Reports | 14:38 |
| Sight Search & Event Tracking | 15:01 |
| Campaign Tagging | 8:33 |
| Event Tracking & Goal Reports | 13:18 |
| Ecommerce & Multi-Channel Funnel Reports | 13:21 |
| Assisted Conversion Report | 11:12 |
| Sampling Explained | 21:51 |
| Google Analytics Campaigns | 18:27 |
Practical
While most courses take more of an academic approach to Google Analytics (which I’ve personally benefited from tremendously), this course takes much more of a hands-on, soup-to-nuts approach to teaching marketers what to report on, and what those reports mean. I break the concepts down in the simplest of terms so that even someone totally new to Google Analytics could follow along.
Basically, any concept that was more difficult for me to grasp in my early days was treated with special care to ensure subscribers have a fighting chance at really mastering the skills needed to put me out of work ramp up your skill set as a marketer. I’m actually jealous of subscribers because this course covers everything I wish I had known starting out.
Affordable
This course is priced at $95 and includes a 97-page workbook and the Excel practice file we go through, step by step, in the course. By the end you will have some badass data visualization skills. Seriously.

Excel Mini Course
Similar to the Google Analytics mini course, there are a few words to describe this course:
Comprehensive
The Excel Mini Course is a pivot on the Annielytics Dashboard Course, which is a full, comprehensive course on how to create dynamic dashboards that connect with Google Analytics in Excel. The Google Analytics Mini Course covers day 2 of the three-day course I originally did in person. It includes 24 instructional videos, totaling 6+ hours of instruction and is the perfect solution if you’re just looking to learn more about Excel but don’t need to build out dynamic dashboards at this time.
Here’s a list of the video titles:
| Excel Formatting | 13:48 |
| Excel Navigation Tips | 16:03 |
| Table Formatting | 18:09 |
| Number Formatting | 22:38 |
| Data Bars | 12:28 |
| Icon Sets | 17:00 |
| Heat Maps | 11:57 |
| Date Alert Formatting | 17:21 |
| Pie & Column Charts | 28:29 |
| Bar, Area & Scatter Charts | 28:57 |
| Creating Pivot Tables | 9:33 |
| Formatting Pivot Tables | 11:72 |
| Pivot Charts | 16:01 |
| Excel Formulas | 11:51 |
| Functions & Dynamic Titles | 12:21 |
| YoY % Change Visualization | 11:31 |
| Combination Column Charts | 14:58 |
| Dynamic Drop Down Chart I | 17:36 |
| Dynamic Drop Down Chart II | 12:40 |
| Dynamic Check Box Chart | 14:03 |
| Dynamic Radio Button Chart I | 16:18 |
| Dynamic Radio Button Chart II | 06:13 |
| Dynamic Scrolling Chart | 14:17 |
| Dynamic Ranges | 14:38 |
Practical
This course teaches marketers what to report on, how to visualize their findings, and how to get their data ready for the catwalk. I break the concepts down in the simplest of terms so that even someone totally new to Excel could follow along. It assumes no prior knowledge and provides instructions for both PC and Mac, something no other Excel course does at the time of writing.
Career Boosting
Seriously, these skills will set your LinkedIn profile on fire. Do you know how desperate companies are for marketers who can walk into a job and be able to help them visualize and make sense of their data? Potential employers will be fighting over you. (And anyone who has followed me knows that I’m not given to hyperbole.)
Affordable
This course is also priced at $95 and includes a 97-page workbook and the Excel practice file we go through, step by step, in the course. By the end you will have some badass data visualization skills. Seriously.
Here’s a list of the video titles:
Terms of Service
Please look over the Terms of Service to read all the scintillating fine print. At least check out the pic of my attorney after writing up this exhausting piece of legalese! 🙂