Problem: I want to show Time on Site the way Google Analytics does, but it shows up in Excel as number of seconds when I export.
Solution: Run a simple formula in Excel to convert, then apply number formatting as follows.
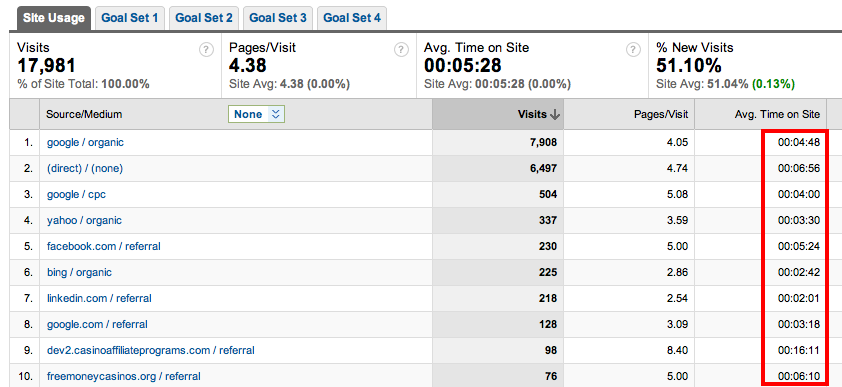
 Many of the reports in Google Analytics show you either time on site or time on page, depending on the report. It follows an easy mm:ss format, with m representing minutes and s representing seconds. So when you export to Excel you’d think that formatting would follow. However, not so much. As soon as you export the data you lose that beautiful, intuitive formatting and end up with something that makes no sense whatsoever. And transforming this data back to its native formatting takes some fancy footwork in Excel. But once you’ve done it a few times it’s easy to remember.
Click for larger image.
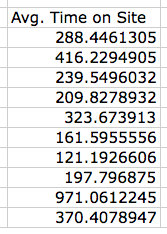
But when you export the report to Excel by clicking the Export tab at the top of the window and selecting CSV for Excel and open it in Excel, it looks like this:
Yucky, huh? Who wants to figure out how long 288 seconds is? (Math geeks need not apply.)
So here’s how you can change your report to show the mm:ss format:
1. The first thing I do when I export a report is to get rid of all the extraneous data I don’t need. So I delete all of the data at the top of the report, which is usually broken down by day. And then if I exported a standard report, I also delete any metrics I won’t be using in my report. Sometimes (oftentimes? most times?) less is more, and I really try to hone in on what I’m trying to demonstrate to a client.
2. For ease of demonstration I deleted all of the columns to the right of Avg Time on Site. In reality, I rarely discard bounce rate since that’s the golden metric, in my opinion. To do this, you don’t have to work in a column adjacent to your time column. It can be several columns down. With that out of the way, select a cell to the right of the first cell in your column.
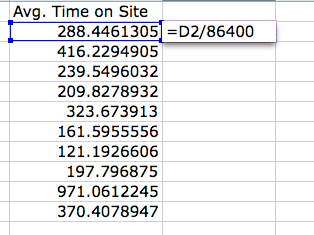
3. Put an = in the cell (signifying we’re going to run a formula) and then select the cell at the top of your time column. This will automatically insert the cell identifier — in my case D2. Then divide by 86400. (This is the product of 60 x 60 x 24. You know … 60 seconds in a minute; 60 minutes in an hour; 24 hours in a day.) Alternatively, you could use =D2/60/60/24, if that’s easier to remember. Gets you the same result. Here’s what your cell should look like:
Tip: Do not put the comma in when you divide by 86400. It’ll gum up the works.
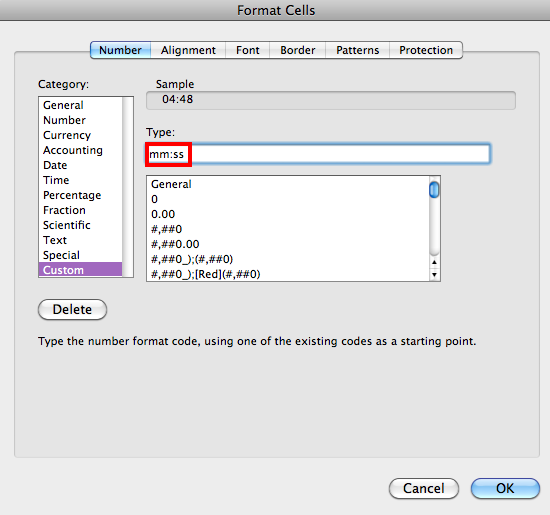
4. Now hit Enter (Mac: Return) to run the formula. Next, press Ctrl-1 (Mac: Command-1) to bring up the Format Cells dialog. Under Category, choose Custom. Replace General in the Type field with mm:ss. This tells Excel that you want this number to be formatted in minutes:seconds, each using two digits.
Click for larger image.
Tip: If you have visitors who regularly stay more than an hour, you can use hh:mm:ss.
5. When you click OK, you will see your shiny, new time format. To apply it to the rest of the column, hover over the bottom-right corner of the cell until your cursor becomes what looks like a plus sign or crosshairs. Then grab that bottom-right corner and drag it down the column. This will apply your formula to the rest of the column. Sometimes you can double-click on that corner to copy it down the column. This stuff is more magical than unicorns.
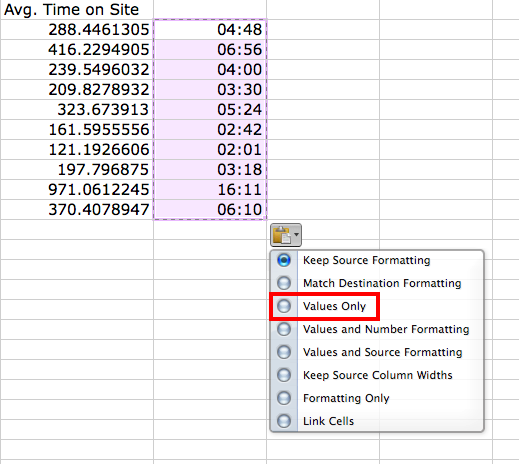
6. Now you would think you could just copy/paste this column over on top of your original column, but you can’t because it will bork all of your formulas. So just select all the cells in your newly formatted column, then copy and paste in place. Yes, I just hit Ctrl-C, Ctrl-V. When you paste you’ll see a little contextual menu that pops up in the bottom-right corner. Select Values Only from that menu. This will eradicate your formulas, leaving only the values behind.
Click for larger image.
7. NOW you can copy/paste your times onto the old times and format your table or chart.
Easy sneezy, eh?
Learn More
You can learn more about data formatting in my Annielytics Dashboard Course, a video course that will teach you how to put your data in stilettos and work the pole. 🙂
OK, this is way appreciated! I was taking the long route…
I manually typed in minutes into the Excel sheet. To convert seconds to decimal, I have a two-cell spreadsheet as my time converter & input seconds into one cell that has formula =B1/60.
86400 is the key! You just saved me a bunch of time!
Yay! That makes me so happy, Dana. Annielytics strikes again. 🙂
My cousin recommended this blog and she was totally right keep up the fantastic work!
GA certification should require this as prerequisite learning. I’ve gotten more use from your blog than the certification. thank you 🙂
That is the highest compliment. Thanks! 🙂
how do you do the opposite? I don’t want the GA format, which is what I have once I exported the data from GA to excel.
Just change the number formatting in Excel. I wrote this post on cell formatting: http://searchengineland.com/easy-to-advanced-uses-of-cell-formatting-in-excel-130203
This post saved my butt today. Thank you!
That’s my main job description: butt saver. 🙂
You Rock! Thanks a lot 🙂
My pleasure! 🙂
Thank you so much! This is so helpful!
Sorry for the horrifically late response! I didn’t realize I wasn’t receiving comment alerts. :/ But awesome! So glad it helped. 🙂
Ugh. I love this post and use it often. But, I’m finding Excel doesn’t give those options with “paste” anymore. Now, I only get with or without formatting. Maybe time for an update?
You still have the ability to format numbers. I use it all the time.
THANK YOU! Just what was needed!
Fantastic!
THANK YOU!
You’re welcome! 🙂
Hi,
Brilliant tip – thank you! I just have one additional tip; I came up against an issue with the formatting when total session duration was over 24 hours; to overcome this I formatted as (custom) [h]:mm:ss.
A great time saver – thank you!
Angela
Uh oh! You shouldn’t ever have a session that lasts > 24 hrs. Do you have events triggering on the page? The session should time out at 30 mins.
Hi Annie,
I was reporting on Session Duration (so total hours) and Ave. Session Duration on a new App launch. So total hours was 138 hours and then average session duration was 4 mins 10 secs etc.
Thanks, Angela
Oh gotcha!
Today Your blog post saved my excel sheet, I was just going to delete the file because of the Average session column value. I was worried why Google Analytics displayed such data. Then I found your post and converted that data into seconds and then analyse the whole data set.
Thank You Very Much!
Regards
Rick
Comments like these make my day! So glad I could make your job a little easier. 🙂
Thank you SO MUCH. I was going the long way. You are my hero.
Haha! You’re very welcome! 🙂
Thanks!
You’re welcome!
Thank you! Super helpful!
Happy to help! 🙂
Thanks Annie, that helped a lot!
Important for non US User (for example with DE GA-Settings):
The seconds will be exported with dots instead of commas.
So you have to change your spreadsheet/excel settings to US-formats before importing.
After that, just divide by 86400 and set the time format. Thats it.
Big Thanks again!
Cheers,
Philipp
Excellent, Philipp! Thanks for circling back!
Thank you Annie, this tip saved my day!
Cheers
Gonzo
Happy to help!
Hi Annie,
Thanks for your post, really helpful!
I need to recalculate average session time after taking out a couple of dates and am not being able to replicate what GA shows for a period. I export the session duration and AVERAGE() gives a higher number. Do you know why?
Thanks a bunch!
Marcos
Hey Marcos,
Can you pop your sheet up onto Google Sheets and share it w/ me, so I can tinker? You can also email to me at annie@annielytics.com.