Annielytics.com

I make data sexy

  • About
  • Resources
  • Services
  • Blog
  • Contact
  • Log In

Nov 23 2012

Change Dashes To Zeroes In Excel

zero from Holes
You had to see the movie “Holes” to get this. 🙂

I might be alone in this, but I hate seeing hyphens in lieu of 0’s in tables and charts. Here’s what it looks like:
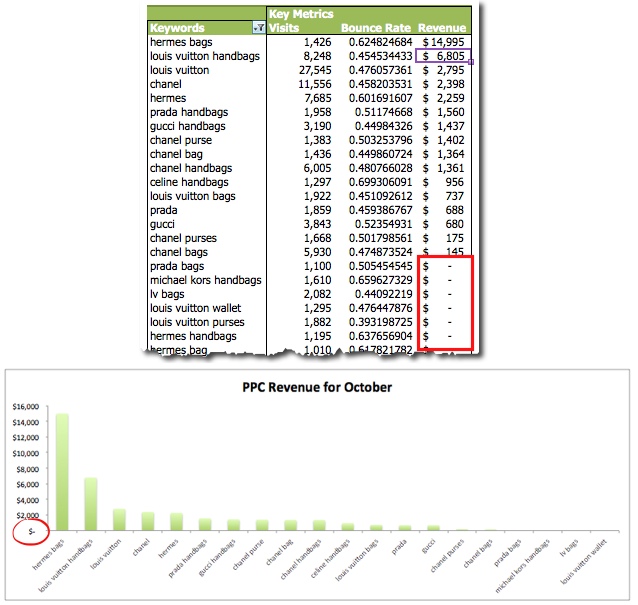
yucky hyphens in lieu of zeros
Click for larger image.


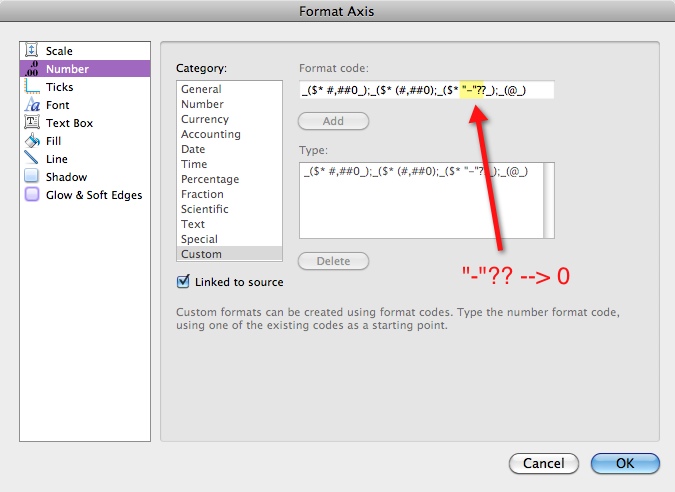
To change these dashes to 0’s select either the column or axis and press Ctrl/Command-1 to open formatting options. The formula, if you will follows this structure:

Positive; Negative; Zero; Text

So just look for “-“?? after the second semicolon and change it to a 0. Easy peezy!

change zero formatting in Excel

You can learn more about custom number formatting from the Microsoft site.

Learn More

For more beastly data visualization tips, check out out my Annielytics Dashboard Course offerings.
Written by Annie · Categorized: Excel · Tagged: Excel Charts, Excel Formatting

Leave a Reply Cancel reply

Your email address will not be published. Required fields are marked *

CAN I HELP YOU FIND SOMETHING?

‘MAKING DATA SEXY’ IS LIVE ?

Want to learn how to create compelling, aesthetically pleasing charts in Excel? Learn how with Making Data Sexy.

Note: Also offered for Mac

STUFF I BLOG ABOUT

LEARN HOW TO USE ALL THE TOOLS

marketing strategy guide

DIY marketing strategy guide. This guide provides step-by-step instructions on how to perform 66 unique marketing tasks using 15 reputable marketing tools (both free and paid). Steal it for $295! Learn more.

LEARN TO DO A SITE AUDIT

site audit template

DIY site audit template. 20 sections, 215 checkpoints, 100+ explainer graphics, 218 pages, step-by-step instructions. Steal it for $295! Learn more.

LEARN TO DO AN ANALYTICS AUDIT

analytics audit template

DIY analytics audit template. 8 sections, 61 checkpoints, 100+ explainer graphics, 205 pages, step-by-step instructions. Steal it for $295! Learn more.

TO THIS DATA I DO THEE WED

dashboard course

Learn to build dynamic dashboards in Excel with Google Analytics data. 16 hours of video, 3 sample dashboards, 142-page workbook, practice Excel file, and more! Learn more.

FOLLOW ME ON TWITTER

SUBSCRIBE TO MY YOUTUBE CHANNEL

Privacy Policy
  • Email
  • LinkedIn
  • Twitter
  • YouTube

© 2022 annielytics.com