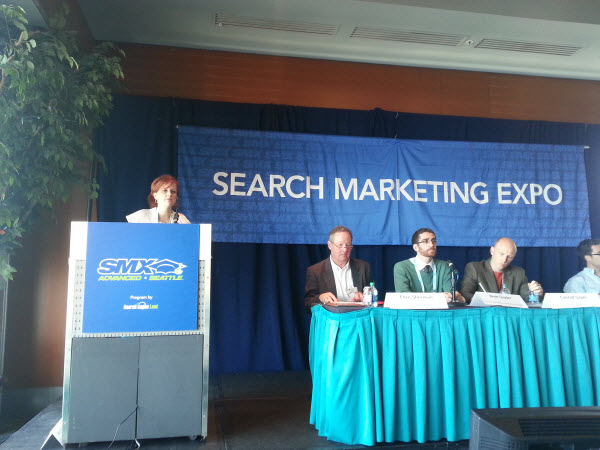
I had the privilege of speaking at SMX Advanced today in Seattle with other data aficionados. I took a slightly different approach (for me at least) and addressed the psychological reasons we, as marketers, need to sexy up our data if we want people to, you know, actually ACT on it.
So here’s the Slideshare presentation:
And here’s the bit.ly bundle with all the links I shared in the presentation.
Came here from http://searchengineland.com/dashboard-series-creating-combination-charts-in-excel-163529. Love that post, and I especially love this presentation!
The idea of keeping reports simple and intuitive so clients use their Automatic Brain instead of their Reflective Brain is really smart. I feel like I’ve subconsciously known that but, until now, didn’t know how to put it into words. Should help me a lot in justifying to the boss my seemingly pointless reporting formatting! Thank you!
You’re very welcome, Lee! Glad it struck a chord with you. 🙂
Dear Annie , congratulations , a very good presentation and funny. I came across from your article about Office MAC 2011 and PivotTables/Charts (bug). Office for MAC sometimes &^&*, but I refuse to work with Microsoft OS. Already bookmarked your page and going to follow closely.
I actually love the Mac OS, but I’m dependent enough on Excel that I had to incorporate more PC into my workflow.
I wanted to use Mac without leaving Windows Excel so I used VMWare to install Windows 10 on my MacBook Air… now I have best of both worlds.