
The approach I took to determining the model difficulty levels and flow strategy for each of the flowcharts were highly subjective and, ergo, beg further explanation.
Difficulty Levels
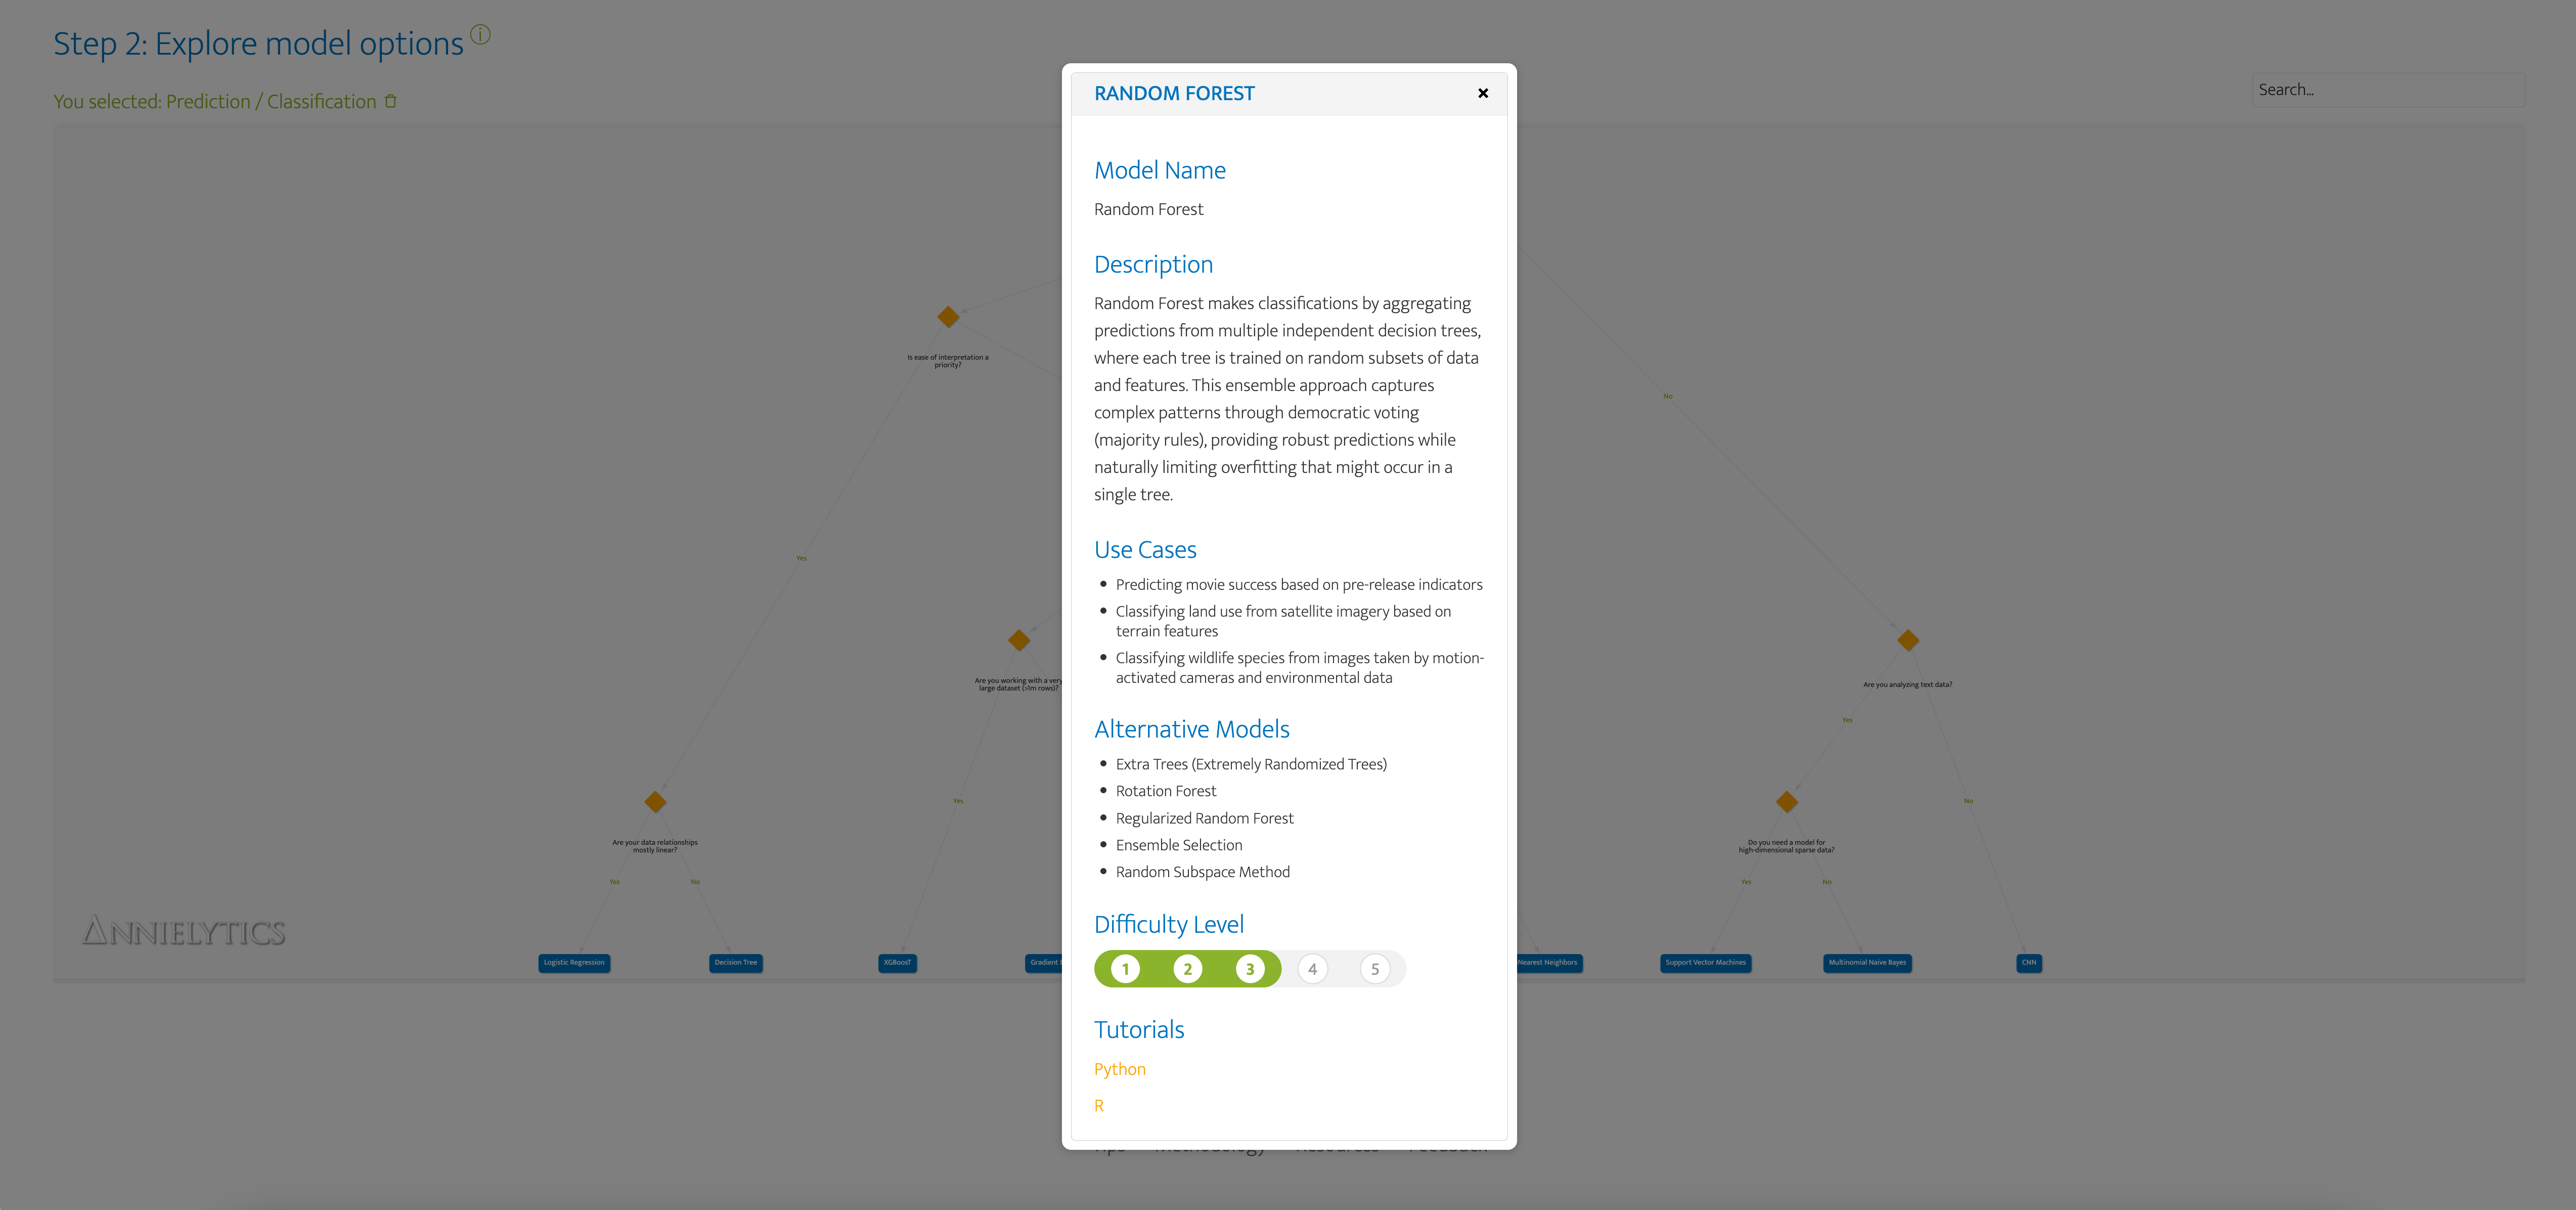
The difficulty levels included in the model modals (aka 'pop-up) are accessible by clicking on any model node, which are the blue rectangular nodes in the flowchart.
My methodology begs explanation since these levels are meant to be a general guide but are quite subjective and could be influenced by personal factors I didn't account for in my approach (e.g., your experience with a particular model)I used AI to generate these levels based on a combination of factors:
- Required background knowledge
- Implementation difficulty
- Data preprocessing requirements
- Available documentation and tools
- Mathematical complexity
- Computational resources required
As always, your mileage may vary.
Flow Strategy
There is a multiplicity of ways I could have approached the logical progression for each flowchart. I used Claude and ChatGPT's reasoning models to assess the best path to arrive at as many machine learning models as possible, playing them against each other until the flow made sense (at least to me).
Just a peek behind the curtain: I sent 6.5 hours bandying back and forth between the two until the 'Reinforcement Learning' flowchart (under the 'Generation' category) had decision nodes, tooltips, and example use cases that captured the nuances in RL options a data scientist is faced with. 🕑🕠🕣
To add to the challenge, these categories and subcategories are not mutually exclusive. To wit, an ordering task may require a neural network, as do some anomaly detection, sentiment analysis, image captioning tasks (to name a few). I decided to focus on end objectives, so if an engineer who's working on optimizing emergency response evacuation routes for a hospital, they can jump to the Order category, fire up the Optimization flowchart and explore the Ant Colony Optimization model. 🐜
Sometimes it felt like splitting hairs to differentiate some of these models, so you may find that a model the tool says doesn't perform well on large datasets may perform just fine on your mega dataset. Also, these models update regularly, so a limitation at the time of development (Feb 2025) may no longer be a limitation in a few years' time. I've scheduled a reminder to audit the data massive json file that underpins the tool every six months, but if you find something amiss, please let me know. 🙏
My 'ELI5' Approach
I took an 'explain it to me like I'm 5 (ELI5)' approach with both the decision node tooltips and the model cards. My reasoning was that more experienced data scientists will mostly be using this tool as a guide and probably won't be too dependent on some of these ancillary tools. The tool may introduce them to models they hadn't considered using for a task. That's specifically why I went back and added the alternative models to the model cards. But beyond that, it will be more of a desktop reference.
However, my concern was that if it was too technical it woudln't be accessible enough for those who are newer to the discipline or just wanting to verify a methodology being proposed by their data science team. Knowing firsthand just how high the learning curve for working with machine learning models is, I tried to simplify some of the more esoteric concepts without losing preciseness. I did that by using everyday analogies to make them easier to understand so newbies don't get caught up in an edy of technical jargon. For anyone who's read my regex guide, campaign tagging guide, or Making Data Sexy book, it should come as no surprise that I'd take this approach to the tool. It's basically my catcher in the rye. 👀
Category Definitions
I've added tooltips to each category and subcategory in the Filter section for desktop, but I wanted to provide these definitions for those on mobile/touch devices.
Association
Association models identify relationships and patterns in data (e.g., detecting co-occurring items in transactions, identifying customers with similar purchasing behavior, or uncovering links between symptoms in medical diagnoses).
Anomaly Detection
Anomaly Detection models identify data points that deviate significantly from the majority (e.g., flagging unusual spending patterns in financial transactions, detecting system failures in industrial equipment, or spotting anomalies in network activity).
Association Rule Learning
Association Rule Learning models identify relationships between variables in large datasets (e.g., discovering frequently purchased item pairs in market basket analysis, detecting co-occurring terms in legal documents, or analyzing temperature and pressure patterns in hurricane formation).
Clustering
Clustering models group similar data points based on patterns (e.g., segmenting customers by purchasing behavior, organizing documents by topic similarity, or categorizing genetic sequences by function).
Community Detection
Community Detection models identify groups of closely connected nodes within networks (e.g., detecting friend clusters in social networks, uncovering research collaborations in academic publications, or identifying covert communication patterns in cybersecurity).
Sentiment Analysis
Sentiment Analysis models determine the emotional tone of text (e.g., classifying customer reviews as positive or negative, assessing public opinion in social media posts, or monitoring shifts in consumer feedback over time).
Topic Modeling
Topic Modeling models uncover hidden themes in text collections (e.g., identifying major discussion points in news articles, categorizing research papers by subject matter, or analyzing customer feedback trends for product improvements).
Generation
Generation models create new content that resembles existing data (e.g., synthesizing realistic images, composing AI-generated text, or producing artificial music based on learned patterns).
Generative Modeling
Generative Modeling models create new data samples that resemble existing data (e.g., synthesizing human-like images for digital avatars, composing AI-generated music for entertainment, or simulating realistic video scenes for training simulations).
Image Captioning
Image Captioning models generate descriptive text for images (e.g., creating accessibility descriptions for visually impaired users, automating photo organization in digital libraries, or providing context for content-based image retrieval).
Machine Translation
Machine Translation models convert text from one language to another (e.g., translating documents between English and Spanish, converting legal jargon into plain language, or adapting programming code from Python to JavaScript).
Reinforcement Learning
Reinforcement Learning models learn optimal decision strategies through trial and error (e.g., training AI to play games by learning from wins and losses, optimizing robot movements for specific tasks, or improving advertisement placement for maximum engagement).
Order
Order-based models optimize sequences, rank items, or arrange elements meaningfully (e.g., planning optimal delivery routes, prioritizing search results, or sequencing manufacturing processes for efficient workflow).
Optimization
Optimization models find the best solution among possibilities (e.g., determining the most efficient delivery routes for logistics planning, allocating resources in supply chain management, or scheduling airline flights to minimize delays).
Ranking
Ranking models order items based on relevance or importance (e.g., displaying the most pertinent search results at the top, prioritizing product recommendations in e-commerce, or sorting news articles by user interest probability).
Pattern Discovery
Pattern Discovery models uncover recurring structures, sequences, or associations in data (e.g., detecting cyclical patterns in customer behavior, identifying seasonal trends in time-series data, or revealing hidden relationships in graphs).
Graph Pattern Mining
Graph Pattern Mining models detect recurring structures within graph data (e.g., discovering frequent molecular structures in chemical compounds, tracing money laundering patterns in financial networks, or analyzing transportation flow in urban planning).
Pattern Mining
Pattern Mining models identify recurring structures, sequences, or itemsets in data (e.g., detecting common DNA sequences in genomic research, uncovering frequently purchased product combinations in retail, or analyzing recurring user behavior patterns in web traffic).
Prediction
Prediction models forecast future outcomes based on existing data (e.g., estimating customer demand, anticipating equipment failures, or calculating credit risk probabilities).
Classification
Classification models sort data into predefined categories (e.g., determining if an email is spam or legitimate, identifying handwritten digits in postal automation, or diagnosing plant diseases from leaf images).
Regularization
Regularization models prevent overfitting by adding constraints (e.g., reducing feature complexity in linear regression, preventing over-reliance on specific neurons in deep learning, or stopping training early to maintain generalization performance).
Regression
Regression models predict continuous values based on input features (e.g., estimating house prices from property characteristics, forecasting revenue from advertising spend, or predicting a car's depreciation value based on mileage).
Sequence Modeling
Sequence Modeling models learn patterns in ordered or time-dependent data (e.g., predicting the next word in a sentence for text completion, forecasting stock prices for investment decisions, or anticipating the next phoneme in speech recognition).
Preprocessing
Preprocessing models prepare data for analysis by cleaning, transforming, or balancing datasets (e.g., removing duplicates, normalizing values, or handling missing information to improve model performance).
Data Balancing
Data Balancing models adjust datasets to prevent bias (e.g., ensuring rare diseases are adequately represented in medical data, addressing imbalanced sentiment in customer reviews, or creating fair representation of minority classes in hiring datasets).
Denoising
Denoising models remove unwanted noise from data (e.g., reducing grainy spots in medical images, eliminating background noise from audio recordings, or filtering out irrelevant signals in sensor measurements).
Dimensionality Reduction
Dimensionality Reduction models simplify complex datasets (e.g., summarizing survey responses into key factors, compressing image data for faster processing, or visualizing high-dimensional gene expression patterns in two-dimensional plots).
Imputation
Imputation models fill in missing data points (e.g., estimating missing temperature readings in climate datasets, reconstructing gaps in medical records, or inferring absent values in customer surveys).
Outlier Detection
Outlier Detection models identify data points that deviate significantly from the norm (e.g., detecting inconsistencies in manufacturing sensor readings, spotting anomalies in industrial systems, or flagging unexpected trends in scientific experiments).
Changelog
Note: The changelog starts Apr 1, 2025.
- 4/3/25: Refactored code to fix tooltip positioning bug on mobile
- 4/1/25: Launched the app